|
I wrote a piece on Medium about my experience as indie app developer. If you love to make things, code or are just thinking about getting started, you might find it interesting.
1 Comment
I'll cover three aspects:
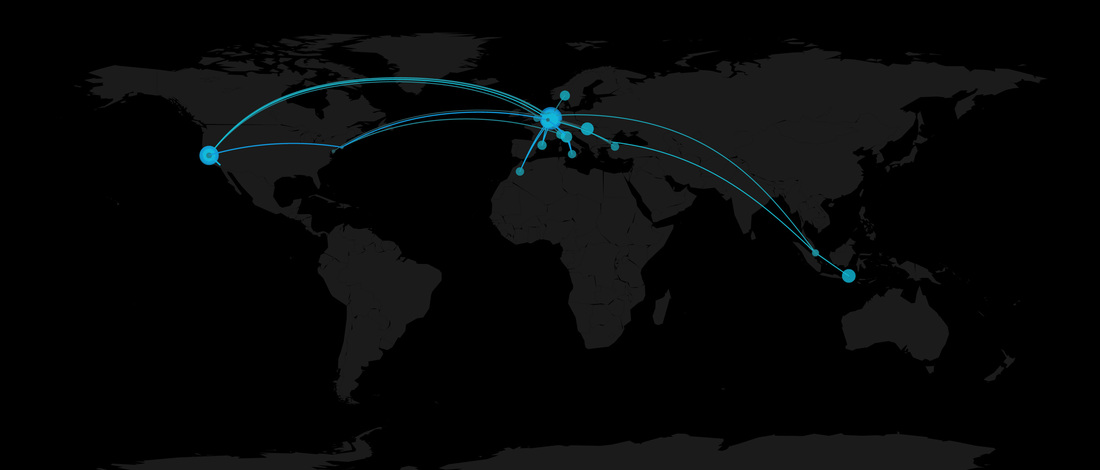
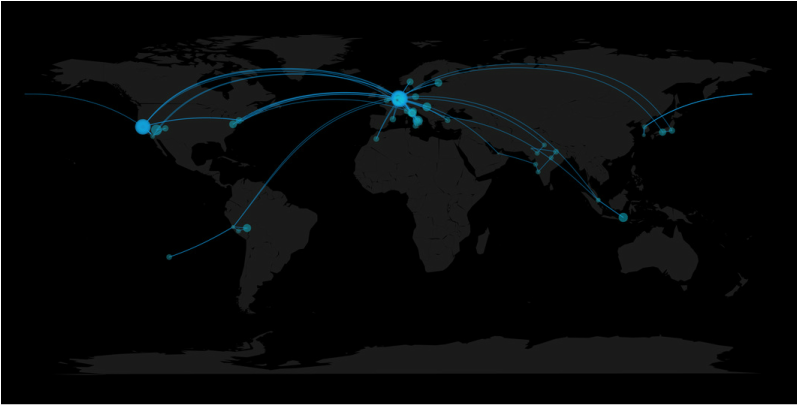
my geotagged pics in 2014 and between december 2011 and april 2015
For a while I wanted to map my flights and the locations I've spent time in throughout the year, so last night I downloaded my location data, which I thought I was tracking for a long time using a few apps. Unfortunately that was not the case. Turns out most apps were not running in the background, and I forgot to start others after rebooting my phone.
What to do? There's one thing I always do. Taking pictures. Everywhere. These days most pictures are geotagged, or at least the ones taken using smartphones. I found a couple of tutorials online on how to extract metadata from JPEGs in R and Python, and eventually worked with R since thanks to Nathan Yau and this post, I could make better looking maps. Another helpful post was on timelyportfolio, explaining how to extract exif metadata using exiftool and R. Quickstart
I haven't tested much the code, but if you are lucky, this should be sufficient to make your own map:
I've got only a few months per year where I'm relatively happy with my trainings. That's more or less between december and april, when temperatures in Holland are low (I suffer the heat too much). This year I measured my HR and HRV every morning while preparing for a half marathon, and I finally collected enough data to explore the two main aspects I'm interested in tracking while training:
As explained in another post, both changes are somehow related to HR and HRV. So let's have a look at what I've got in about three months of measurements. Hardware & Software
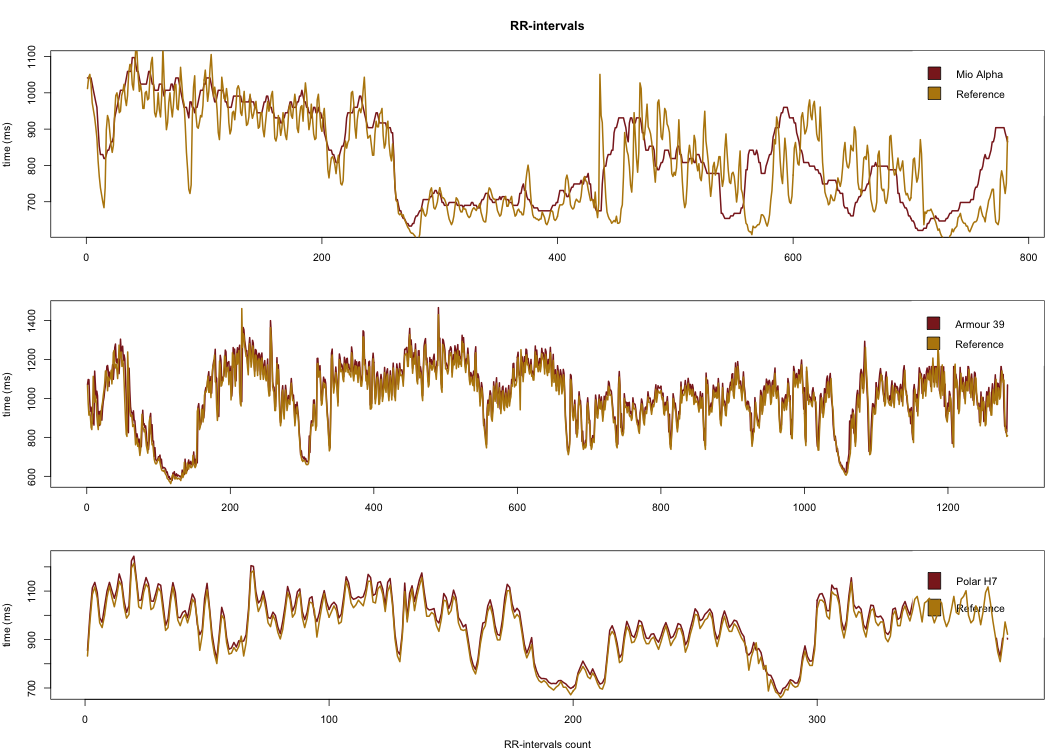
Hardware:
All measurements were taken using either Under Armour's Armour39 or Polar's H7, given the high reliability. I took the measurements right after waking up, while still in bed. Software: I used HRV4Training, with the following settings:
HR & HRV
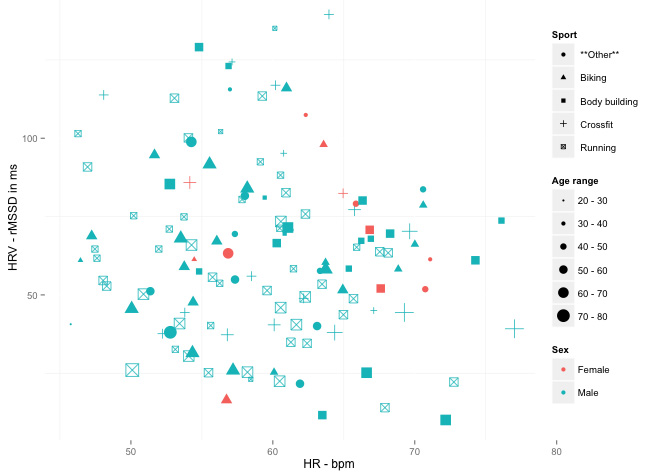
The only HRV feature I will consider in this analysis is rMSSD, together with average heart rate. There are a lot of reasons why rMSSD should be used instead of other features. Most importantly, its reliability for short duration measurements and the high correlation with training load shown in past research. For more information have a look at Andrew Flatt's and Simon Wegerif's blogs. They are both amazing resources if you are interested in HRV research with focus on training. Getting some perspective on my values
Any physiological parameter is very personal and should always be looked at in relation to our own baseline. While your heart rate can be normalized with respect to your age-predicted maximal, the situation is a bit more complicated for HRV, where there is no predefined range or zones. However I did want to get some perspective on my values, compared to what is out there.
I plotted simulations from my data together with data simulated according to what was reported in literature about rMSSD values [3,4] (this is another advantage of using this feature, since frequency domain features are computed differently by everyone, and even if HF power is also considered a good proxy to parasympathetic activity, it's almost impossible to compare results published in literature). 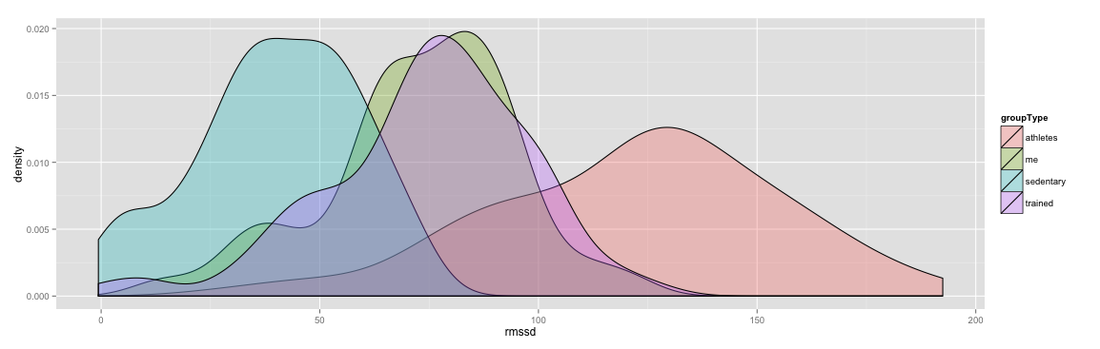
The distributions are quite wide (published results come from very few subjects, typically in the order of 10). Hopefully soon enough I'll get enough data from HRV4Training to be able to provide better ranges for different populations (age and gender also play a factor here). Anyway for the moment this still shows some meaningful data, since I overlap with the "trained subjects" population, which falls between sedentary and athletes.
 I just came back from a very exciting (and tiring) two days in Baltimore, where I was invited for the final of the Armour39 Challenge. It all started in November last year, when Under Armour decided to crowd source their R&D and the future of their Armour 39 platform. The Armour39 wearable sensor was launched early 2013. Similarly to what UA usually organizes for their Future Show, where last year more than 4000 applicants competed, they crowd sourced software development for this April's Digital Future Show. Given the experience I have with wearable technology and my passion for running, I thought it was a pretty good match, and decided to give it a try. The competitionI'm gonna start with the outcome of the competition, followed by my thoughts after the whole thing finished, which are certainly biased by the outcome. Then, I'll cover in detail my submission. The competition was divided into three phases. We had first to submit a proposal outlining our idea (sometime in November). 50 proposals were selected and moved on to the second phase. At this stage we all received a development kit including the A39 sensor and an SDK to access the non-standard data stream (i.e. everything that is not heart rate). We had between January and March to develop our prototypes, and had to submit a video and report (see below for both of them). Up to 15 projects were selected and moved on to the final phase, consisting of a presentation in Baltimore at the Digital Future Show. Eventually it was only 5 teams reaching the final: 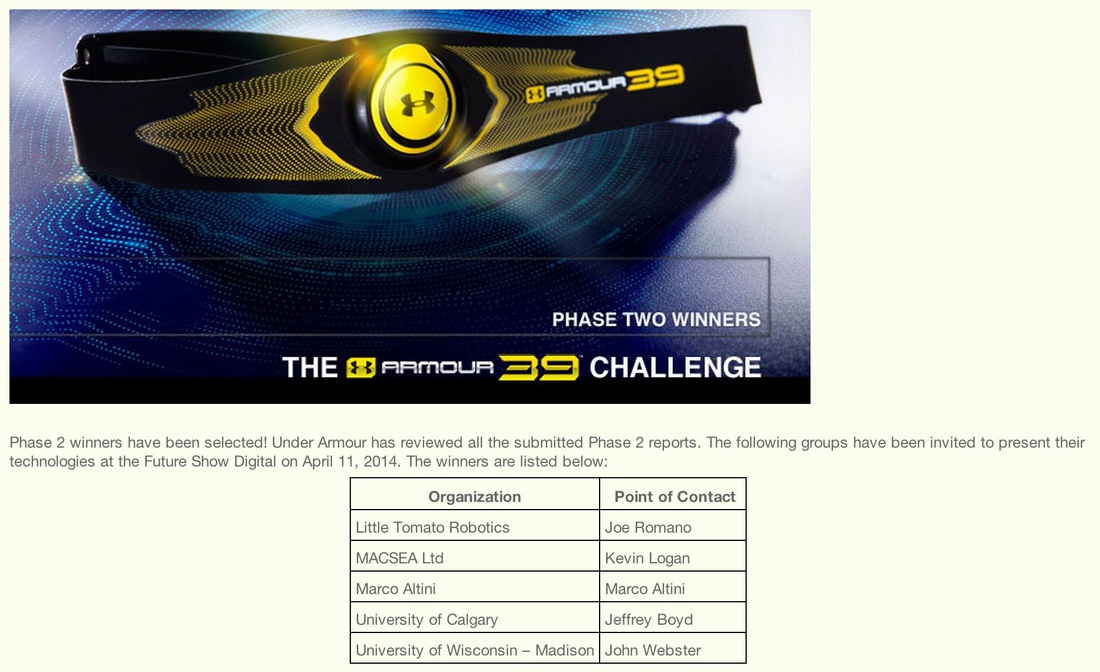
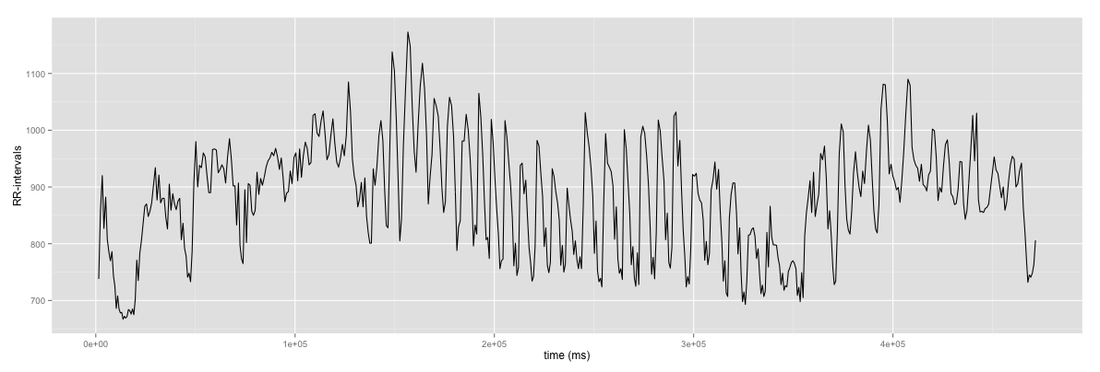
Here is the good news: it is indeed possible to achieve good accuracy in HRV measurements using this technique, but the methods needed are slightly more complicated than acquiring a video and computing peak detection on the PPG signal (which is sufficient for heart rate measurement). This post covers the steps involved in the implementation of Camera HRV, the iPhone app I developed to measure HRV using the phone's camera. The algorithms are part of HRV4Training since version 3.2. Later in 2017, we have also validated these methods and published the results with respect to ECG and Polar straps, showing equivalency. You can find the full paper here. Overview1 - Data acquisition from the phone's camera
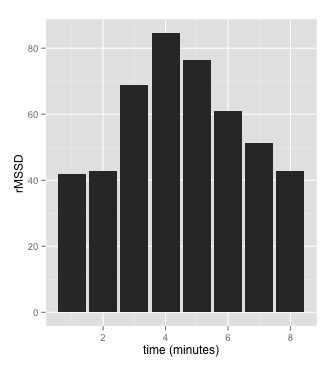
2 - Filtering & smoothing 3 - Resampling with cubic spline interpolation 4 - Peak detection 5 - Artifact removal and features extraction 6 - Comparison with heart rate monitors (Polar H7) 7 - Tips
IMPORTANT: this post is outdated. HRV4Training offers now many more features and a better user experience, please refer to HRV4Training.com for the latest updates. Thanks.
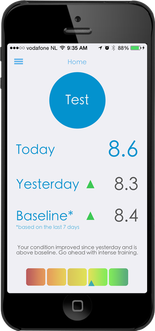
HRV4Training is an app that helps you optimize your goals and prevent overtraining by measuring your Heart Rate and Heart Rate Variability (HRV). I built this app while trying to understand better how I was recovering from my running trainings, since HRV is a proxy to parasympathetic activity and therefore physiological stress (read more here). HRV4Training does not require a heart rate monitor, since it can accurately assess your HRV using the phone's camera.

This post serves as a quick start guide for the app, while more details on HRV features and HRV analysis for fitness can be found in previous posts.
Overview + Hardware & Software (+data) |
Marco ALtiniFounder of HRV4Training, Advisor @Oura , Guest Lecturer @VUamsterdam , Editor @ieeepervasive. PhD Data Science, 2x MSc: Sport Science, Computer Science Engineering. Runner Archives
May 2023
|
 RSS Feed