I'll cover three aspects:
1. Dataset
HRV4Training is a paid app in a niche market. Users agree upon installation to terms and conditions allowing me to collect data for research purposes, which hopefully will lead to better future versions of the app. As of today (Jan 2015), the app was downloaded 1365 times. However, for most of the following analysis, I will consider only users that filled in their personal information (age, sex and sport practiced). For the last part of the analysis the dataset is further reduced to include only users who manually annotated their trainings.
1.1 Users
Data from 876 users was collected in Parse during 2014. While this is certainly not an impressive number, it's way more than regular studies on HRV, and sufficient to provide insights on the relation between HRV and training intensity. Out of the 876 users, 695 filled in their personal data. From these 695 users, I collected 20263 HRV measurements and 7760 manually annotated trainings. Here we can see the number of active users per week, the overall number of measurements collected every week and the average number of measurements per user per week:
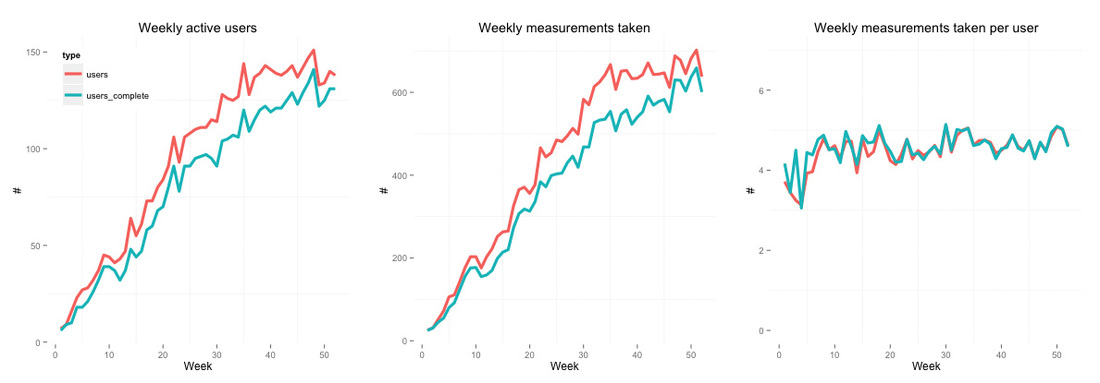
The red line represents the total number of users (876), including the ones that did not provide their personal data, while the green line represents users (695) that filled in personal data information. The first useful bit of information we can extract is that on average users take 4 to 5 HRV measurements per week, which should be sufficient to get a stable HRV baseline, according to literature (Flatt et al. "Comparing heart rate variability mean values from 7, 5 and 3 days in a team of female collegiate soccer athletes").
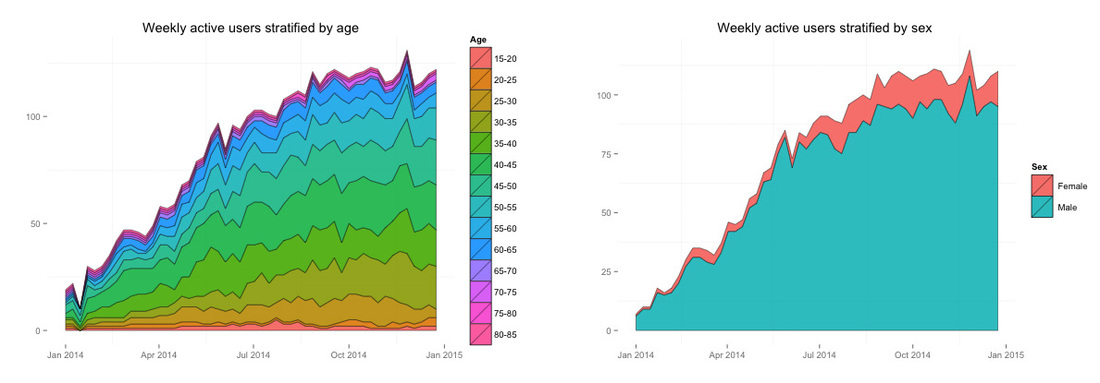
Users span over a wide range of ages (40.8 ± 10.5) and sports, however they are mainly men (86.9%). The relative percentage of man and women did not change with increased userbase (click on the figures to enlarge), nor did the distributions of age ranges, that stayed pretty much constant:
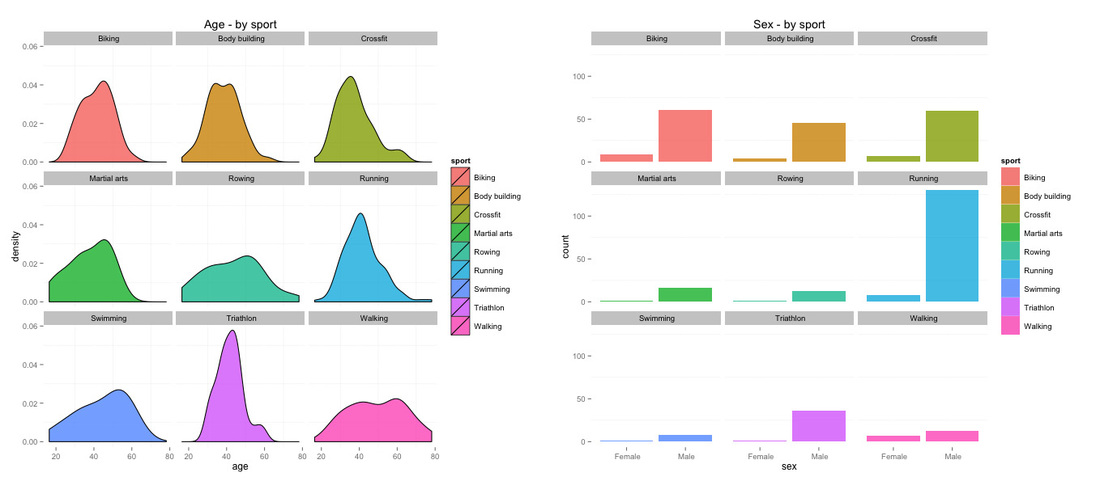
Additionally, HRV4Training lets users provide input on the sport they practice. Here is the relation between age, sex and sport, on my dataset. There seem to be trends between preferred sport and age. For example, body building and crossfit seem to be practiced by a younger population, while swimming and walking by an older one. Unfortunately we cannot say much on the relation between sport and sex, given the limited number of women in the dataset. Running was the most common sport, followed by biking, crossfit, body bulding and triathlon. Here we are showing only the nine most selected sports:
1.2 settings
HRV4Training lets users configure different settings for their measurements. Users can pick between 1, 3 and 5 minutes recordings, 6, 8 and 10 breaths per minute for the guided breathing, orthostatic or single test, and finally the sensor type (bluetooth or camera). The app lets also choose between an advanced view where all HRV features are shown, and a simplified basic version where recovery is summarized in a single feature. As expected, most users use the camera version of the app, for short 1 minute recordings, and the default 8 breaths/minute configuration (not shown). 52% of the complete dataset are single, 1 minute tests at 8 breaths per minute. Considering that for orthostatic tests the first half is equivalent to single tests, 59% of the dataset can be analyzed as if it was recorded using the same settings.
2. HRV Recordings
Let's move on to the HRV data. Here I will look at summary statistics as well as try to extract some useful information from data stratified by age. All measurements are completely unsupervised, with all the issue that user generated data have (noise, misuse of the app, etc). Thus, I will consider only users who used the app for at least one month, which should produce a subset of more reliable users. This procedure leaves me with 230 users, 15937 measurements and 6449 annotated trainings. From the remaining measurements I removed obvious outliers (e.g. heart rate values at rest outside of the 30-160 beats per minutes range), and measurements with high noise, as determined by the Bluetooth sensor or camera algorithm. I ended up with 13758 measurements of clean data from regular users.
The mean rMSSD over the dataset was 66.1 ± 28.3, which shows a tendency in high HRV values compared to what was reported in different studies on HRV in the average population (i.e. sedentary participants). See for example Melanson et al: "The effect of endurance training on resting heart rate variability in sedentary adult males". The study be Melanson et al. reports values between 25 and 35 in rMSSD for the sample population before starting the training program, and values in the range between 40 and 60 after 16 weeks of training program. The higher values found in this dataset are expected considering that most people interested in an app like HRV4Training have an obvious interest in optimizing their training routine and stay in a good shape. HR was 60.3 ± 8.0, also relatively low and indicative of good fitness level for most users. 2.1 HRV & age
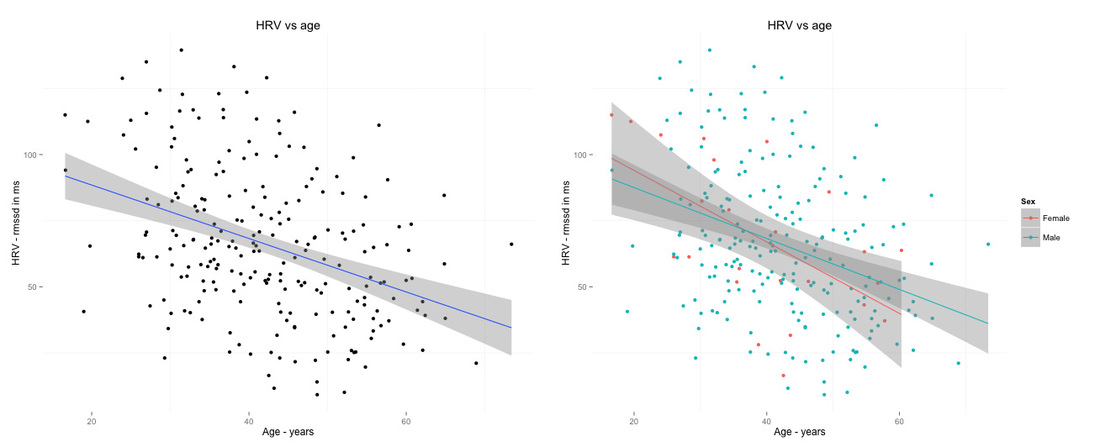
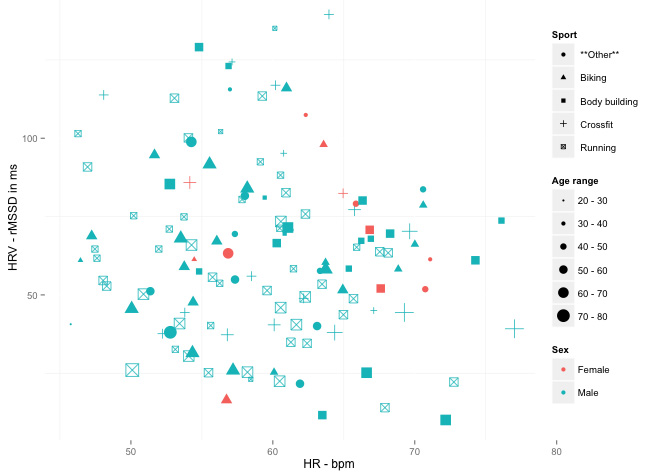
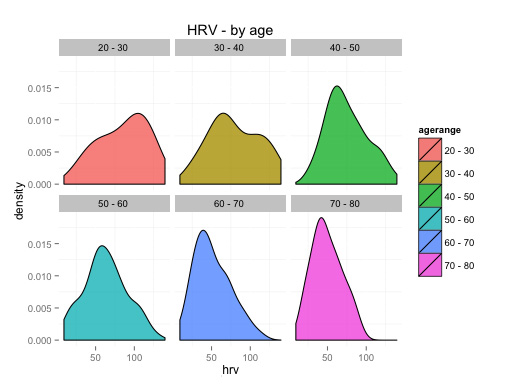
There is a known inverse relation between HRV and age. Here we can see it over the HRV4Training dataset. The relation hods across sex:
3. HR, HRV & Training
Finally, we move on to the most interesting bit. Let's look at the relation between HR, HRV and training intensity. This analysis is similar to the one I've performed before on my data. However, there are a few more challenges when looking at user generated data. Since I have no idea what users are doing, how they train, if they get injured, what's their fitness level, how they use the app, etc. I need a reliable way to determine if HRV is of any use, as it is measured by HRV4Training. I cannot look at data longitudinally, since I cannot make assumptions on the users' condition over time (while I knew my fitness level when analyzing my data, I have no reference points for other users).
However, HRV4Training lets you manually annotate your trainings. You can pick between easy, average and intense training annotations. Quite a few users use this feature. As a matter of fact, the app is much more useful if you do, and it turns out this is also my way to determine effectiveness of HRV measurements in determining physiological recovery. Here is an example of a few months of measurements and annotations for one user. The height of the bars represents HRV (i.e. rMSSD, top plot) and HR (bottom plot) values. The bar color depends on the annotated training intensity: 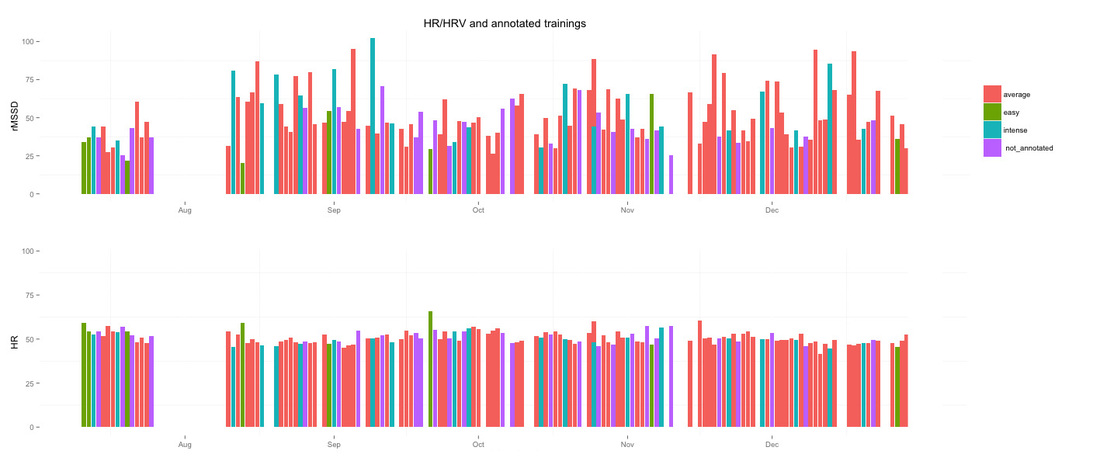
We can spot right away a decrease in HRV value the day after an intense training, for most intense trainings, as well as an increase in HRV for the day following an easy training, for most easy trainings. Another interesting aspect is the day-to-day variability in values. While HR stays pretty constant over time, HRV varies much more.
To evaluate the impact of training intensity on HR and HRV, I proceeded as follows: for each user with sufficient data (determined as at least one month of measurements and manually annotated trainings), I isolated data depending on training intensity (i.e. easy, average and intense). Then, I looked at changes in HR and HRV for days following easy and intense trainings. Looking at the day after the training allows to determine the impact of training intensity on HR and HRV. Results are very similar to what I previously found on my data. HR does not seem to be able to capture day to day changes in physiological recovery, and therefore is a poor tool for guiding training. On the other hand, changes in HRV measurements between days following easy and intense trainings were marked and (statistically) significantly different. The difference is clear when looking at percentage differences in HR and HRV with respect to the user average HR/HRV (see later for details). 3.1 HR & training intensity
HR seems to capture changes due to training intensity similarly to HRV, however the differences are tiny, in the order of 0 to 1%, or less than 1 beat per minute:
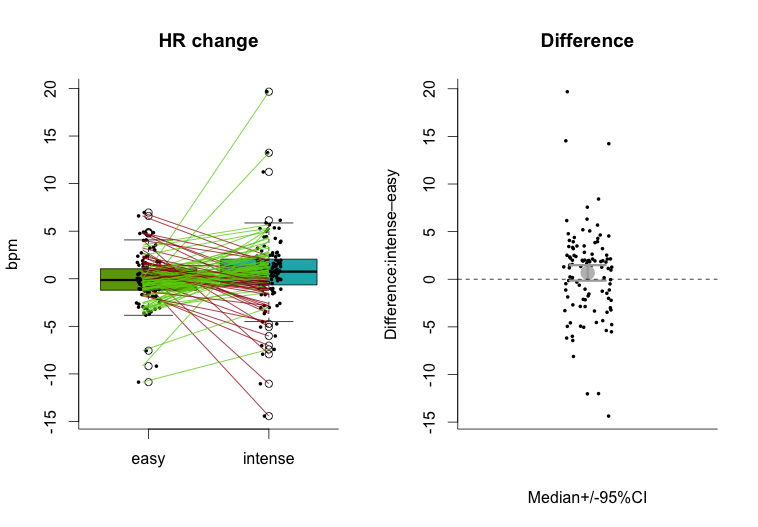
Green lines show expected behavior, i.e. intense trainings trigger an increase in HR higher than easy trainings. However, this is not the case for many users (red lines). The difference between the two conditions is shown on the right. There might still be outliers (for example mistakes in manually annotating trainings), or cases I haven't thought of, so probably not all the red lines are representative of the inability of HR to capture physiological changes due to training load, however there are enough users to draw preliminary conclusions.
HRV shows much bigger deviations from baseline, due to training (remember the relation is inverse, lower HR means better recovery, and higher HRV means better recovery). We could see it already from the previous plot showing a couple of months of data for one user, however here are the details:
3.2 hrv & training intensity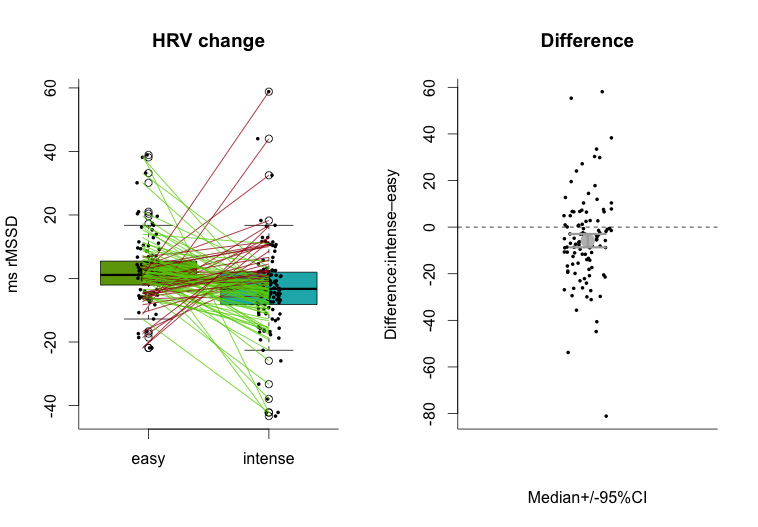
Here green lines show expected behavior, which is inverted compared to the HR case, i.e. intense trainings trigger a decrease in HRV higher than easy trainings. There are still some outliers, or users for which this analysis couldn't capture the relation between training intensity and HRV, however the red lines are much less, and the inverse relation between training intensity and HRV is clearly visible. On a side note, if you are interested in plotting paired data in the way it is shown above, look at this tutorial.
Takeaways
Marco
20/1/2015 08:35:14 am
I know the source of each measurement, however it's either one or the other, there is really no reference since measurements are taken at different times, even for the users using both, and as you can see there is a lot of variability between measurements.
Tom
4/3/2015 03:40:43 am
Marco- any thought about annotating sick and/or stressful (not exercise related, maybe like rough work day, personal/emotional stress,) days? I ask because I started using your app while I was sick. I think it would help explain some variations in HrV.
Marco Altini
4/3/2015 05:06:40 am
hi Tom,
Hans
22/3/2015 03:01:45 am
Great write up. I do not use your app as I do not have an iphone. However I have been using two other apps via a bluetooth HR strap on android. With over a years worth of data I believe you have confirmed what I have noticed. In addition I am now trying to test HRV in relation to performance - as a better indicator of stress during events. this is also n=1 stuff but it would be nice to hear if users are conducting performance test using HRV. Comments are closed.
|
Marco ALtiniFounder of HRV4Training, Advisor @Oura , Guest Lecturer @VUamsterdam , Editor @ieeepervasive. PhD Data Science, 2x MSc: Sport Science, Computer Science Engineering. Runner Archives
May 2023
|
 RSS Feed