|
I've got only a few months per year where I'm relatively happy with my trainings. That's more or less between december and april, when temperatures in Holland are low (I suffer the heat too much). This year I measured my HR and HRV every morning while preparing for a half marathon, and I finally collected enough data to explore the two main aspects I'm interested in tracking while training:
As explained in another post, both changes are somehow related to HR and HRV. So let's have a look at what I've got in about three months of measurements. Hardware & Software
Hardware:
All measurements were taken using either Under Armour's Armour39 or Polar's H7, given the high reliability. I took the measurements right after waking up, while still in bed. Software: I used HRV4Training, with the following settings:
HR & HRV
The only HRV feature I will consider in this analysis is rMSSD, together with average heart rate. There are a lot of reasons why rMSSD should be used instead of other features. Most importantly, its reliability for short duration measurements and the high correlation with training load shown in past research. For more information have a look at Andrew Flatt's and Simon Wegerif's blogs. They are both amazing resources if you are interested in HRV research with focus on training. Getting some perspective on my values
Any physiological parameter is very personal and should always be looked at in relation to our own baseline. While your heart rate can be normalized with respect to your age-predicted maximal, the situation is a bit more complicated for HRV, where there is no predefined range or zones. However I did want to get some perspective on my values, compared to what is out there.
I plotted simulations from my data together with data simulated according to what was reported in literature about rMSSD values [3,4] (this is another advantage of using this feature, since frequency domain features are computed differently by everyone, and even if HF power is also considered a good proxy to parasympathetic activity, it's almost impossible to compare results published in literature).
The distributions are quite wide (published results come from very few subjects, typically in the order of 10). Hopefully soon enough I'll get enough data from HRV4Training to be able to provide better ranges for different populations (age and gender also play a factor here). Anyway for the moment this still shows some meaningful data, since I overlap with the "trained subjects" population, which falls between sedentary and athletes.
Trainings
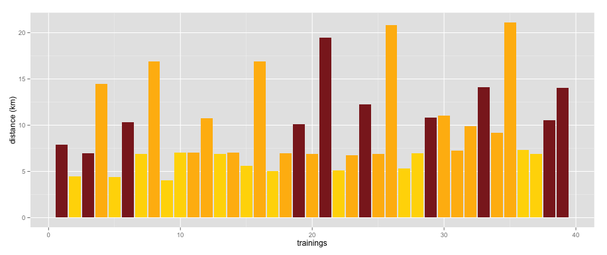
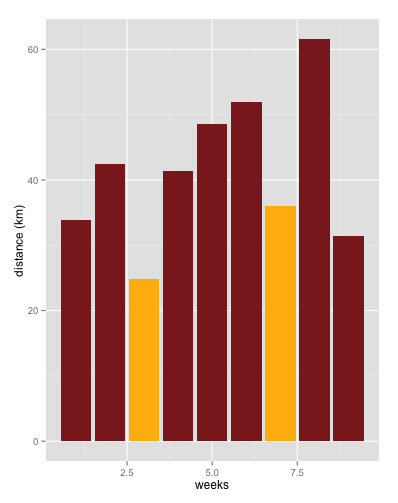
To give more context, here are my trainings distances for the period I'm going to analyze (annotated according to HRV4Training color scheme):
There were quite some improvements, I went from being in trouble running 10km at 5 min/km to training at ~4.35 min/km for distances between 10 and 14 km. I didn't run any race, so there was probably some margin (4.30 to 4.05 min/km for 1 km intervals). Unfortunately I do not have reference fitness measurements, but this gives an idea of the improvement over time.
Short term changes: recovery and training load
During these three months, I did not adapt my training based on HRV. The reason is that I wanted to first do the opposite, i.e. train according to my plans, and see what HRV changes I was going to be able to capture. By analyzing these changes a posteriori I can get a good understanding of how my trainings impact my physiology, and start adapting my future trainings.
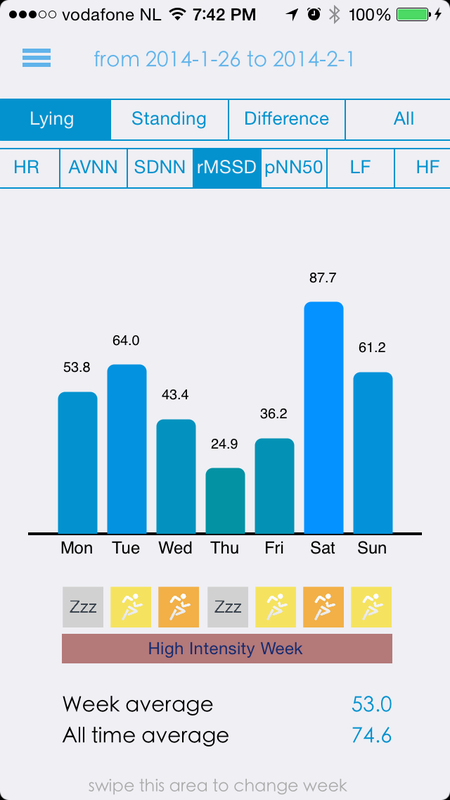
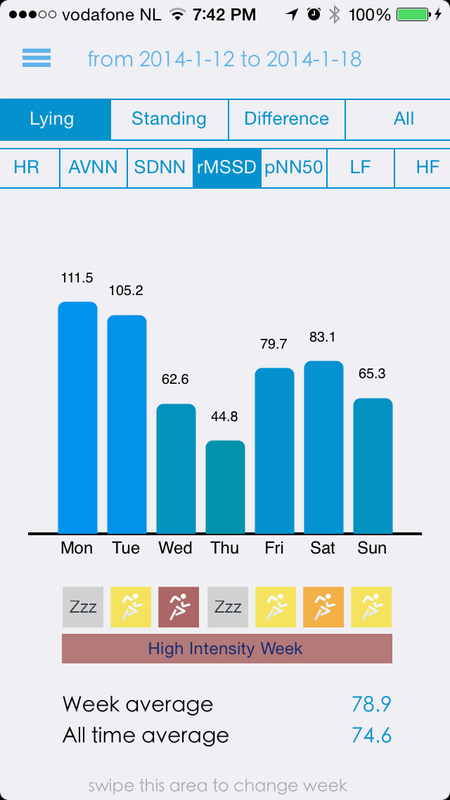
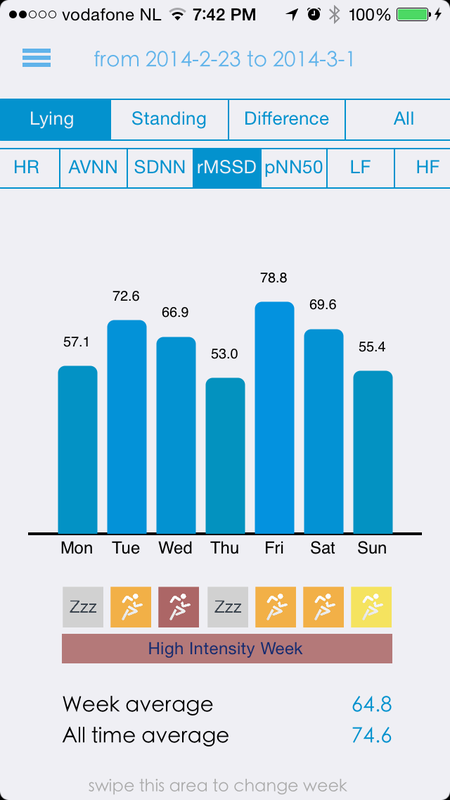
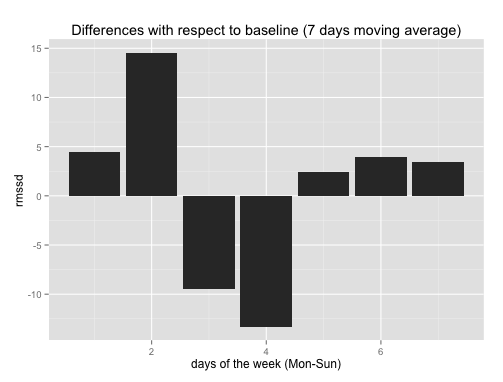
We'll start by looking at HRV day to day changes. These variations have been used to guide training programs and to determine recovery state [5]. A pattern I see often in my data is the one showed in these three plots. Following the two trainings on Tue and Wed (typically interval trainings on Wed), I always score the lowest in the week on Thu. This is quite a consistent sign. My body is asking for a break. Following rest on Thu, values go back up on Fri (easy training) and Sat. Here I'm showing rMSSD, but the same applies to HRV4TFitnessPoints, which are derived from rMSSD.
Another important aspect that we can see from these plots, is the importance of looking at relative changes between consecutive days (or with respect to your baseline), more than absolute values. Values on Thu are very different (24 to 53 range), however in each situation they are showing high physiological stress, since HRV is going down for multiple days in a row.
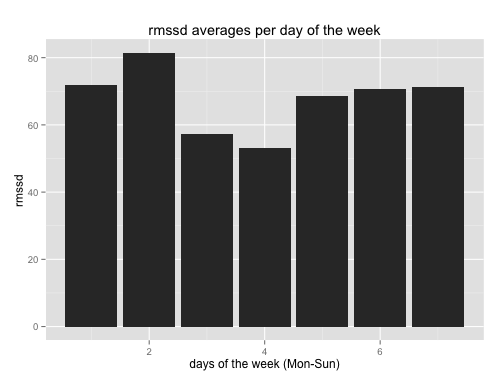
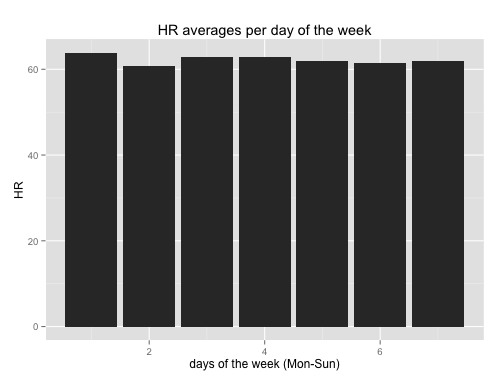
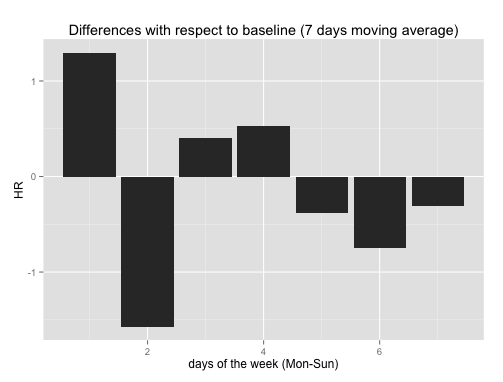
Since I trained always the same days, the reduction can be seen in the average values per day of the week (first plot below). The second plot shows the difference in rMSSD with respect to the current baseline, averaged over week days (i.e. for each day I computed the baseline based on the past 7 days, and removed it from the rMSSD value, then I averaged by day of the week). Here it's clear again, then when looking at HRV with respect to baseline, the biggest positive jumps are seen in days when I did not train (from Mon to Tue and from Thu to Fri, with differences of 10 and 15 points), while consecutive training days show smaller changes and can go negative below baseline (Thu is my "you need a break" day).
HRV-based advice, provided by HRV4Training, focuses on this day to day variability, analyzing your baseline, today's score, and the last 2 days of data. As just shown, these values correlate quite well with training intensity/load and need for recovery. The magnitude of the difference, especially with respect to baseline, could also be used to provide better advice. Something to investigate in the future.
In light of what follows (spoiler: HR seems better than HRV for fitness), here I am also plotting the same analysis but for heart rate, which shows small changes (~1 beat/minute) and the inability of HR alone to capture differences in training load and recovery that we just documented using HRV:
Bottom line, HRV is helpful to monitor recovery/training load, HR isn't (according to my data/experience)
Long term changes: fitness and VO2max
While I was somewhat confident that day to day variations and differences from baseline could capture physiological stress (it was reported in so many studies after all), I am a bit more skeptical on fitness level and VO2 max estimations that don't require exercise. I'm doing some work in my PhD research on estimating cardiorespiratory fitness level from activities of daily living, and you do need some level of activity, to determine how the body reacts to certain stressors (even just looking at heart rate while walking can provide very good indications).
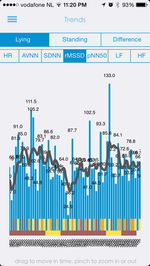
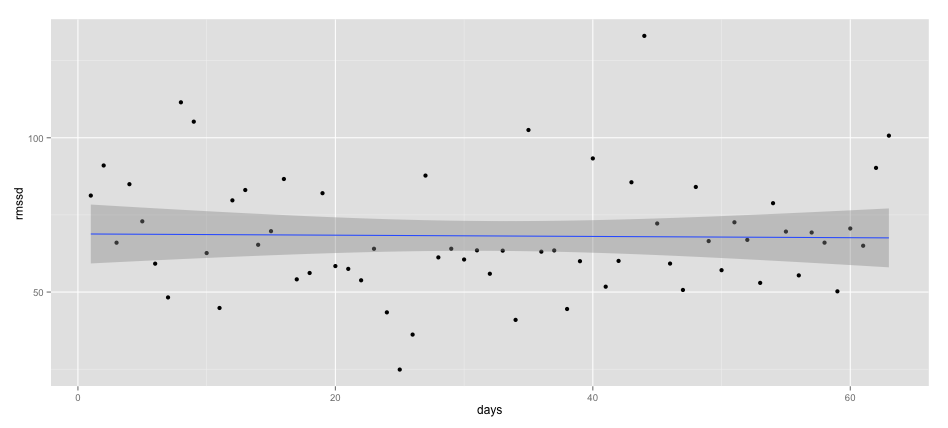
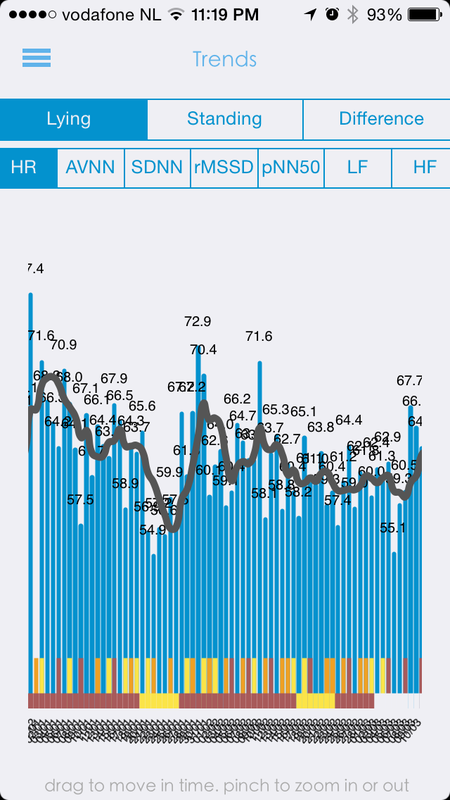
Athletes have higher HRV compared to other populations, however while at the cross-sectional level higher HRV can be related to higher VO2max, this does not mean that at the individual level we can assess changes in VO2max/fitness by using HRV at rest. Another issue I see here is that changes in HRV due to training are quite strong (i.e. values can vary more than 3x between consecutive days), and even understanding what HRV values to use to assess VO2 max can be a problem. Are we less fit because we trained hard on the track yesterday? Most likely not. Many studies tried to go that way, but most of the times HRV did not appear to be increased in a dose-dependent manner with increasing levels of physical activity [6] (i.e. training increased VO2 max but not HRV). As a matter of fact, most studies typically report changes in resting heart rate, but no changes in HRV [7,8]. Resting heart rate changes are slower and less variable on a day to day basis, thus might be a better proxy to overall fitness level, leaving HRV for the day to day variability and recovery assessment. Let's look at some data. Here is the same period analyzed before, but this time we are looking at trends over the full period. I annotated all trainings and training weeks in HRV4Training, so you can see them overlapped to the HRV measurements. The second plot fits a regression line to all the data, showing no relation between increased fitness and HRV (values at the beginning seem higher actually, which might be due to lower training loads):
Now let's look at heart rate:
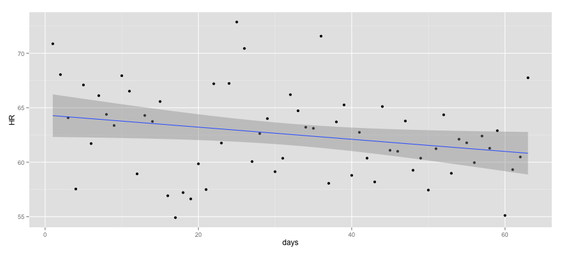
Here we can see a relationship, with heart rate progressively decreasing while improving my fitness level through training (the relation is statistically significant).
Bottom line: HR is helpful in monitoring fitness level, HRV isn't (according to my data/experience) What's next?
I'd like to get a better feeling of the relation between training intensity and changes in HRV. So right now I'm running with a heart rate monitor, to be able to better quantify training intensity based on heart rate zones, and the impact on HRV.
References
[1] Ginsburg, P., Bartur, G., Peleg, S., Vatine, J. J., & Katz-Leurer, M. (2011). Reproducibility of heart rate variability during rest, paced breathing and light-to-moderate intense exercise in patients one month after stroke. European Neurology, 66(2), 117-122
[2] Kobayashi, H. (2009). Does paced breathing improve the reproducibility of heart rate variability measurements?. J Physiol Anthropol, 28(5), 225-230. [3] Mourot, L., Bouhaddi, M., Perrey, S., Cappelle, S., Henriet, M. T., Wolf, J. P., ... & Regnard, J. (2004). Decrease in heart rate variability with overtraining: assessment by the Poincaré plot analysis. Clinical physiology and functional imaging, 24(1), 10-18. [4] Nunan, D., Sandercock, G. R., & Brodie, D. A. (2010). A Quantitative Systematic Review of Normal Values for Short‐Term Heart Rate Variability in Healthy Adults. Pacing and clinical electrophysiology, 33(11), 1407-1417. [5] Kiviniemi, Antti M., et al. "Endurance training guided individually by daily heart rate variability measurements." European journal of applied physiology 101.6 (2007): 743-751. [6] Melanson, E. L. (2000). Resting heart rate variability in men varying in habitual physical activity. Medicine and science in sports and exercise, 32(11), 1894-1901. [7] Lee, C. Matthew, and Albert Mendoza. "Dissociation of heart rate variability and heart rate recovery in well-trained athletes." European journal of applied physiology 112.7 (2012): 2757-2766. [8] Grant, Catharina C., et al. "Relationship between exercise capacity and heart rate variability: Supine and in response to an orthostatic stressor." Autonomic Neuroscience 151.2 (2009): 186-188.
3 Comments
3/4/2015 10:20:15 am
This is the best, most useful overview of HRV I've seen online. Grabbed the app based on the above, and finding it to be outstanding.
Reply
Sam
13/6/2015 08:47:21 pm
Terrific work, both in analysis and in write up. I really appreciate the effort, and will subscribe for future updates. Thanks!
Reply
Beer dude
25/6/2015 02:13:09 pm
I could grab a beer with you. You seem awesome
Reply
Your comment will be posted after it is approved.
Leave a Reply. |
Marco ALtiniFounder of HRV4Training, Advisor @Oura , Guest Lecturer @VUamsterdam , Editor @ieeepervasive. PhD Data Science, 2x MSc: Sport Science, Computer Science Engineering. Runner Archives
May 2023
|

 RSS Feed