
Heart Rate Variability Logger is an app I developed to record, plot and export time and frequency domain Heart Rate Variability (HRV) features (as well as heart rate and RR intervals). The app is available for iPhone. This post is a short user guide where I cover in more detail the different features and some implementation choices.
App features:
I tried to cover also most of the questions that I got by email in the last few months. Please comment or email me if you have other comments or requests for future versions. More specifically, the post covers: 1. Introduction on HRV and applications 2. Hardware requirements 3. Quick start guide 4. Data acquisition and signal processing pipeline 5. RR-intervals correction 6. Features extraction 7. Data export and format 1. Introduction on HRV and applications
The cardiovascular system is mostly controlled by autonomic regulation through the activity of sympathetic and parasympathetic pathways of the autonomic nervous system. HRV analysis attempts to assess cardiac autonomic regulation through quantification of sinus rhythm variability. The sinus rhythm times series is derived from RR intervals (R peaks of the QRS complex derived from the electrocardiogram (ECG)), by extracting only normal (NN) intervals.
Since HRV aims at quantifying autonomic regulations, it can be used as marker of sympathetic or parasympathetic predominance, and therefore become relevant in many applications. In athletes for example [1] heavy training is responsible for shifting the cardiac autonomic balance toward a predominance of the sympathetic over the parasympathetic drive, and HRV analysis attempts to quantify this shift (see this post for more on HRV for training). Other applications span from stress monitoring during public speaking [2] or daily life [3], assessment of pathological conditions [4] and even emotional regulation during financial decision-making (trading) [5]. If you are new to HRV, check out our Ultimate Guide to Heart Rate Variability (HRV). 2. Hardware requirements
Heart Rate Variability Logger requires a Bluetooth Low Energy (also called Bluetooth Smart or BLE or 4.0) heart rate monitor. Personally, the most reliable I tried is Polar's H7 which we also validated in this paper. The first iPhone to support BLE was the 4S.
3. Quick start guide
Open the app, and push the Bluetooth icon to connect to your heart rate monitor. No pin or passcode is required to connect to Bluetooth low energy monitors, the only thing you need to do is to turn on your Bluetooth radio. The app will prompt you in case your Bluetooth radio is off. Once you are connected, the real-time view will be enabled and HRV logger will start processing RR-intervals and computing features. More details in this slideshow (includes info on experience sampling, activity and location tracking):
4. Data acquisition and signal processing pipeline
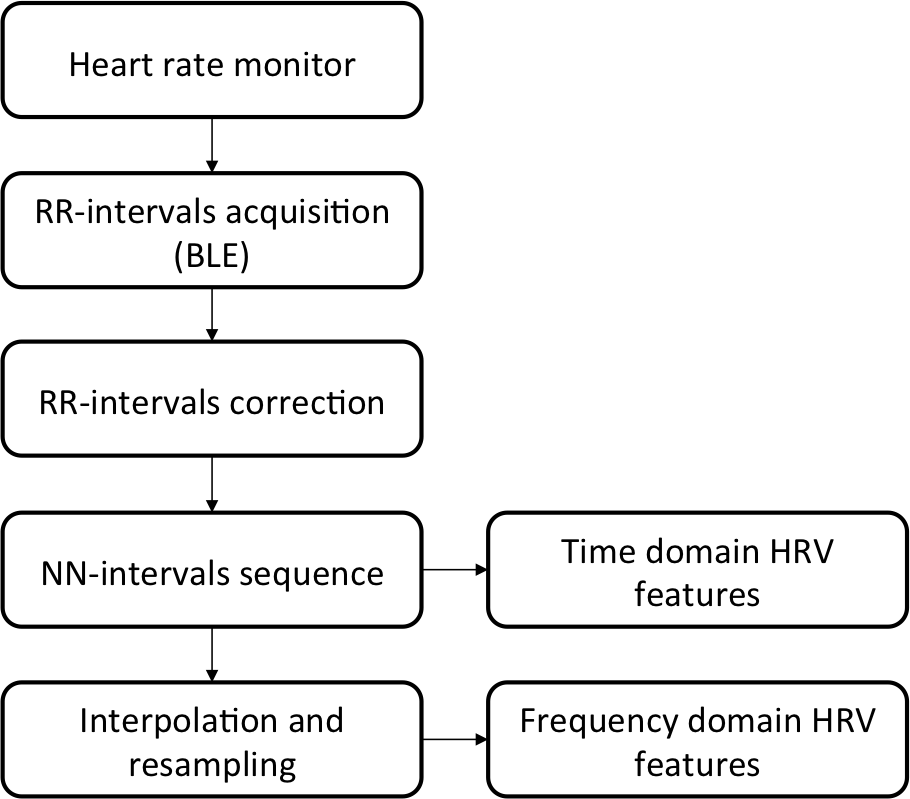
The following block diagram represents the signal processing pipeline implemented in HRV logger. The single blocks are explained in more detail in sections 5-6.
5. RR-intervals correction
RR-Intervals correction prevents artifacts due to ectopic beats or motion from affecting features computation, as often reported in literature for HRV analysis.
It is advised to keep RR-interval correction to 20%, meaning that every RR-interval which differs by more than 20% from the previous one, will be discarded. HRV Logger provides three options, the correction can be completely disabled, in case you are interested in looking at PVCs or other events. By default the correction is set to 20%. The third and last setting is 50%, which is a less aggressive correction, since every RR-interval which differs by more than 50% from the previous one, will be discarded. 6. Features extraction
The time window used to compute features can be configured choosing between 30 seconds, 1, 2 or 5 minutes. Windows of at least 2 minutes should be used when using low frequency features (LF) [2]. Given the non-constant frequency at which RR-intervals are received, a buffer of RR-intervals is used to collect 30 seconds to 5 minutes of data, on which features extraction is executed.
The following features are extracted from RR-intervals:
The term NN (e.g. AVNN) is used instead of RR to emphasize the fact that the beats used to extract HRV features are sinus beats (this is also why it is important to keep the RR-interval correction enabled). Assuming we have $n$ beats in our buffer: RR-intervals Time-domain features AVNN, mean of NN intervals: \[AVNN = \frac{1}{n} \sum_{k=1}^n NN_k\] SDNN, standard deviation of NN intervals: \[SDNN =\sqrt{\frac{1}{n} \sum_{k=1}^{n} (NN_k - AVNN)^2}\] where AVNN is computed as above. rMSSD, square root of the mean squared difference of successive NN intervals: \[rMSSD = \sqrt{\frac{1}{n-1} \sum_{k=1}^{n-1} (NN_{k+1}-NN_{k})^2}\] pNN50, number of pairs of successive RRs that differ by more than 50 ms The difference between beats is calculated as above: \[NN_{k+1} - NN_{k}\] Then, if $n50$ is the number of beats for which we have a difference greater than 50 ms ($(NN_{k+1}-NN_{k}) > 50$), pNN50 is computed as: \[pNN50 = \frac{n50}{n} 100\] Frequency-domain features Since RR-intervals come at non-constant frequency, they are linearly interpolated before frequency analysis. After interpolation, a hamming window is applied before performing the FFT. Accelerometer Motion Intensity Motion Intensity (MI) is computed after filtering the accelerometer data to remove the static effect due to gravity (basically isolating dynamic movement only). Accelerometer is sampled at 2Hz, to prevent battery drain. Assuming $n$ filtered accelerometer samples, MI is computed as follows: \[MI = \frac{1}{n} \sum_{k=1}^n ACC_{k} \] where $ACC_{k}$ is the sum of the absolute signal over the three axis: \[ACC_{k} = abs(ACCx) + abs(ACCy) + abs(ACCz) \] MI should be use simply to get an indication of the user movement when carrying the phone. Especially in situations where HR and HRV can be affected by both movement and stress, it can help in acquiring more context. For iPhones 5S motion intensity is replaced by the actual steps taken, computed using the M7 co-processor. Location Tracking Location tracking is available since version 4.0. By enabling location tracking you can add even more context to your HRV recordings. If coarse location information is sufficient, do not enable the high accuracy location tracking, since it will drain more battery (uses GPS). 7. Data export and format
Data can be exported either by connecting your iPhone to iTunes, or by connecting HRV Logger to your Dropbox account. Four files are exported for each recording:
All files are in csv format, making it easy to import them in other tools. The example files include approximately 2 hours, split in half sedentary and half running. References
[1] Aubert, André E., Bert Seps, and Frank Beckers. "Heart rate variability in athletes." Sports Medicine 33.12 (2003): 889-919.
[2] Kusserow, Martin, Oliver Amft, and Gerhard Tröster. "Analysis of heart stress response for a public talk assistant system." Ambient Intelligence. Springer Berlin Heidelberg, 2008. 326-342. [3] Vrijkotte, Tanja GM, Lorenz JP van Doornen, and Eco JC de Geus. "Effects of work stress on ambulatory blood pressure, heart rate, and heart rate variability." Hypertension 35.4 (2000): 880-886. [4] Nolan, James, et al. "Prospective study of heart rate variability and mortality in chronic heart failure results of the United Kingdom heart failure evaluation and assessment of risk trial (UK-Heart)." Circulation 98.15 (1998): 1510-1516. [5] Fenton-O'Creevy, Mark, et al. "Emotion regulation and trader expertise: Heart rate variability on the trading floor." Journal of Neuroscience, Psychology, and Economics 5.4 (2012): 227. [6] Berntson, Gary G. "Heart rate variability: Origins, methods and interpretive caveats." Psychophysiology 34 (1997): 623-648.
39 Comments
Leo
7/2/2014 11:55:36 am
Dear Marco,
mihryazd
13/2/2014 10:59:30 am
Dear Marco
Marco Altini
13/2/2014 04:03:21 pm
I am not familiar with Kubios but all steps implemented in iOS for frequency analysis are manually implemented (linear interpolation, hamming windowing) except for the FFT which is performed using iOS libraries. Everything that I manually implemented was double checked against MATLAB interpolation and windowing functions.
David Coneff
6/3/2014 02:07:59 pm
I know this post is old, and you've probably moved on to bigger things since this app.. but have you thought about adding a poincare plot of the LF/HF?
Marco Altini
6/3/2014 03:20:00 pm
Thanks for the suggestion David. As far as I know Poincare plots should be used to plot RR intervals at time n against RR intervals at time n+1. The shape of the plot can be indicative of various factors (from disease to most likely stress as well). Anyway, I'll see what I can do. Thanks again!
Adrian Corella
9/3/2014 07:21:38 am
Marco, just downloaded your HRV logger app for Android. So far working great. However, could you please change the naming scheme of the files so that they can be fully compatible with Dropbox? Currently the time uses a colon, which produces problems with Windows. See: https://www.dropbox.com/help/145/en
Marco Altini
9/3/2014 05:30:58 pm
Hi Adrian, I overlooked the time format (which indeed includes a colon), thanks for pointing it out. I've just uploaded a revised version.
Amanda
16/7/2015 02:30:17 am
Hi Marco, I would love to be able to check out the android version of this App. Is there somewhere I can download it?
serg
12/3/2014 09:13:23 am
does it work with http://www.amazon.com/gp/product/B0096DM3ES/ref=wms_ohs_product?ie=UTF8&psc=1
Marco Altini
12/3/2014 04:39:42 pm
it's bluetooth 4.0/low energy, so it will work
hagen
17/3/2014 08:31:24 am
Hi Marco. Thanks for that good APP.
Marco Altini
17/3/2014 06:06:50 pm
Hi, indeed the downloadable file is probably not the best example. It's data collected with the mio alpha, which averages a lot the data to get a stable HR, and therefore it's useless for HRV analysis. Using a Polar you won't have this problem (data is sampled at much higher frequencies, and the accuracy is 1 ms). I'm gonna have a look at the problems, however I find it very difficult to debut on Android due to the huge fragmentation.
Sean
21/3/2014 08:40:54 pm
This is a great tool and the raw data and IOS app are extremely useful, both for sports and psychological use. Thanks for all the hard work.
Marco Altini
21/3/2014 09:58:25 pm
Hi Sean, unfortunately I haven't tested the Zephyr HxM Smart Heart Rate, so I'm not sure on how it compares against a Polar. Polar is for sure very accurate (you can have a look at the hardware section here: http://www.marcoaltini.com/2/post/2013/12/heart-rate-variability.html). No immediate plans to develop desktop software, but might happen in the future. Thanks for your feedback.
al
31/3/2014 05:31:29 am
Really interesting Marco. Will purchase app once I get my h7.
Marco Altini
31/3/2014 06:02:43 am
Hi al,
Brett
4/8/2014 06:19:13 am
Hi Marco.
cogsci
5/2/2015 12:26:47 pm
This is a great piece of software!
Mike
4/9/2014 06:51:53 am
Hi Marco, great app! Can you give a quick guide on how best to use it to check for exercise overtraining? I was thinking something like every morning do 2 minutes and compare the RR-Intervals data with last days. If it changes a lot than take a rest day?
Tim
30/9/2014 12:13:28 pm
Hey Marco,
Doug
9/10/2014 12:16:23 pm
If you have trouble with the app not detecting your Heart Rate monitor like the Polar H7 then UNPAIR the device with your iPhone.
cogsci
5/2/2015 11:01:17 pm
Again great app.
Hey there
Marco Altini
1/3/2015 11:12:43 pm
hi there,
David
4/3/2015 05:43:14 am
Hi! I'm interested in using this in conjunction with the mio alpha. Specifically, I'd like to be able to pull data off of the alpha after the fact (eg. wear the watch without pairing it to an iphone and then examine the heart rate measures later). Would you app allow me to do this?
Marco Altini
4/3/2015 06:27:50 am
hi David, the mio alpha doesn't store data, so you'll have to keep your phone connected and around you. The app allows you to export all data afterwards (and visualize it in real time)
David
4/3/2015 11:27:57 pm
Thanks for the fast reply! Sorry, I meant the mio alpha *2* which can hold up to 25hrs of data in memory. According to the manufacturer it will export all the data to their app once a device is paired. I realize you probably haven't tested your app with this device, but do you have any sense of whether it would work the same way?
Marco Altini
5/3/2015 12:40:18 am
Hi David,
Lars
16/3/2015 04:17:22 am
Hi
Samantha Brown
1/4/2015 11:11:47 am
Hello,
Marco Altini
1/4/2015 07:02:35 pm
hi Samantha,
Mike
6/4/2015 07:29:50 am
Hey Marco,
Marco Altini
6/4/2015 08:32:41 am
hey Mike,
Tony
6/4/2015 12:26:33 pm
Hi Marco,
Marco Altini
6/4/2015 04:26:45 pm
Hi Tony,
Andreia
4/8/2015 09:58:15 pm
Hi Marco,
David
13/3/2016 02:01:24 pm
First of all, congratulations on wrapping up your PhD and recent publication in JAP! Also for a fantastic app (HRVLogger). Could you please explain to me how the app handles data dropout? For example if I collect data for an hour and subject with hr strap walks away and loses contact with Bluetooth connection for 5 minutes, what happens? To existing data prior to losing connection? Will auto-connection to Bluetooth happen when in range again? Why about subsequent data connection? Thanks!!
Marco Altini
13/3/2016 02:27:54 pm
Thank you David! I must say I haven't used this app myself in a long time, however if I recall correctly the app when it loses connection, tries to connect again (I implemented this reconnection mechanism for some users that were losing connection during the night, due to the body impeding the communication), all data between the two connections is lost since the sensor doesnt have memory, but the data should be timestamped correctly so that you can reconstruct where the gap is. Hope this helps!
Lance
29/9/2019 11:18:04 am
Dear Dr. Altini Your comment will be posted after it is approved.
Leave a Reply. |
Marco ALtiniFounder of HRV4Training, Advisor @Oura , Guest Lecturer @VUamsterdam , Editor @ieeepervasive. PhD Data Science, 2x MSc: Sport Science, Computer Science Engineering. Runner Archives
May 2023
|
 RSS Feed