|
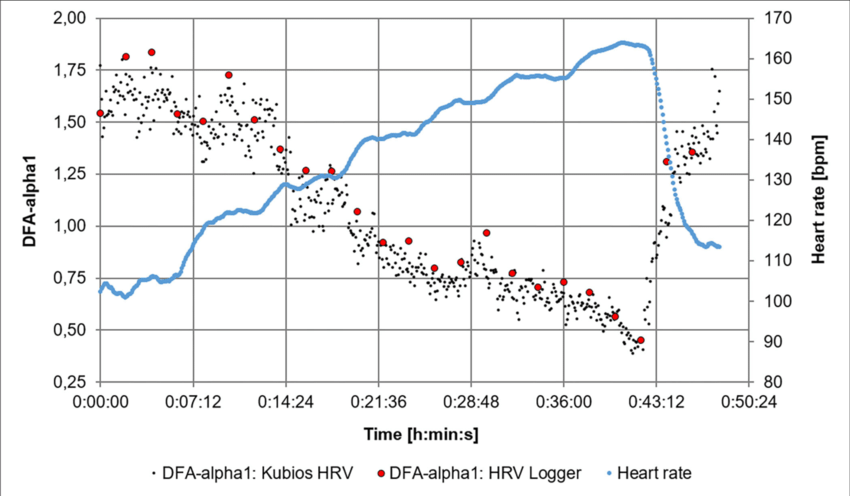
About one year ago, following a few interesting exchanges via email with Sander Berk at Dutch Triathlon, as well as with Raúl Celdrán, Alan Couzens and James Cobb on Twitter, I got more interested in HRV analysis during exercise. Early research from Thomas Gronwald and co-authors had shown that you could potentially identify the aerobic threshold using this method. This looked like a potentially useful way to assess exercise intensity without the need for indirect calorimetry, lactate meters or even knowing our maximal heart rate. A few months later I added DFA alpha 1 to our general purpose research app, the Heart Rate Variability Logger, which became the first tool able to offer this analysis in real-time. I had also released code for others to use, which was indeed picked up by many, developing the various options currently available. The proliferation of these tools, led to many more people trying out the method, more research groups collecting and analyzing data, and more insights on the strengths and limitations of DFA alpha 1. This is exactly how research should work. As scientists, we need to be able to look at the data and the new evidence, and update our view accordingly. Otherwise, we are doing a really poor job. Given the data that I have seen in the past months, both anecdotally from users and in published literature, it is undeniable now that we cannot promote the use of a universal threshold (0.75) to detect the aerobic threshold at the individual level. In this post, I cover in more detail current issues and potential applications of this type of analysis, which certainly remains of interest, even though not for the reasons originally thought. Issues with the universal thresholdIn my original post explaining this method, I had mentioned the following main reasons to look into this:
These were the two main aspects I could think of. Otherwise, I would just use heart rate, as I have done successfully for many years. The idea of not requiring to know maximal heart rate is of course appealing, especially for beginners in endurance exercise. But let's look at the data now. For my own, you can look here. In this blog I will however show best case scenario data only, to highlight how even in the best circumstances possible, the data is still not useful at the individual level. What does it mean to look at the best case scenario? It means that we look at data collected while cycling indoor and cleaned of artifacts (or discarded), collected with the best sensors available (H10 or full ECG). The data was processed in Kubios, the software typically considered as reference. We have two studies, published in the past few weeks, both showing how the data cannot possibly be used for individual guidance:
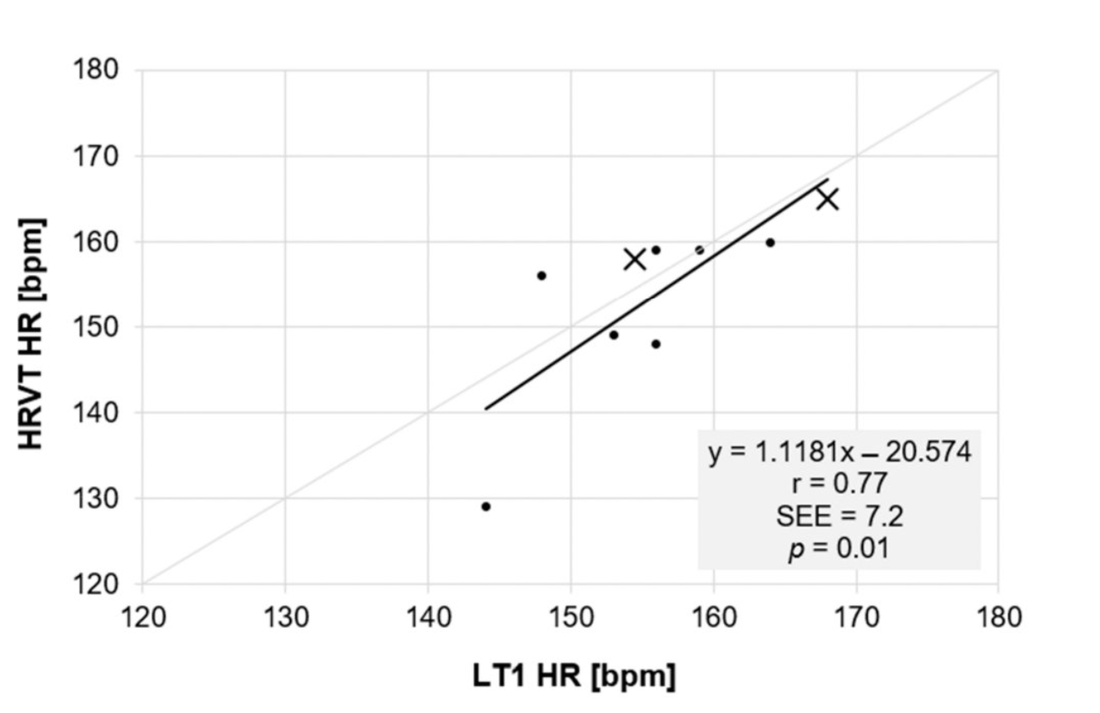
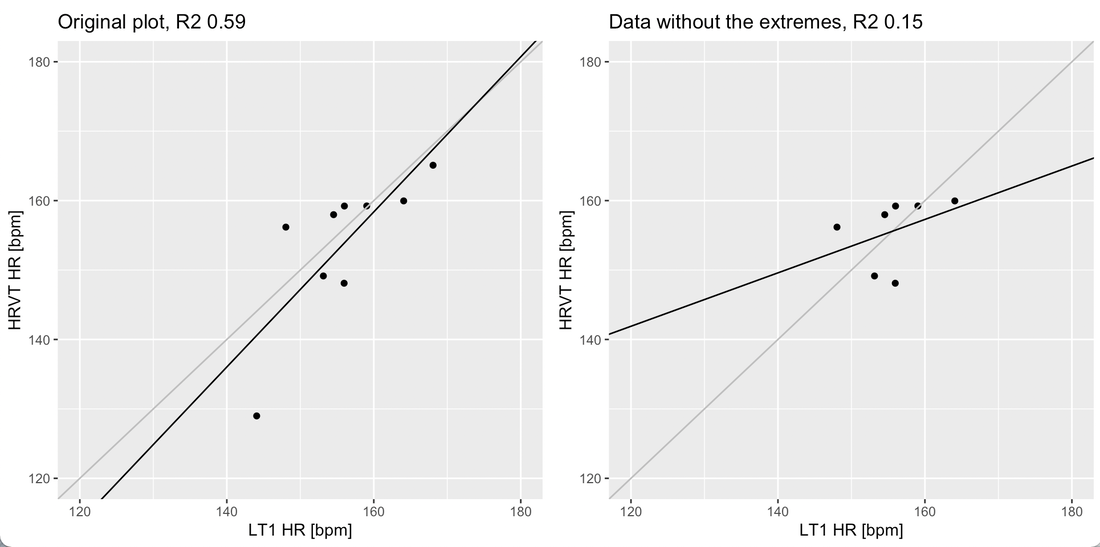
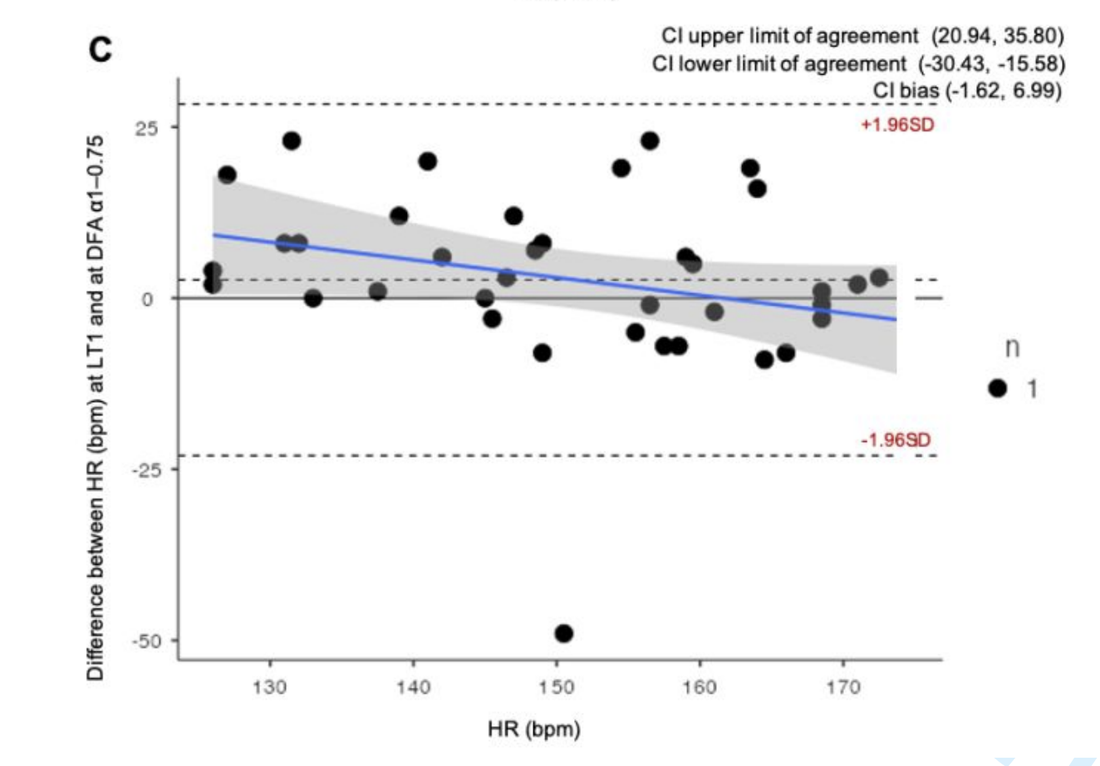
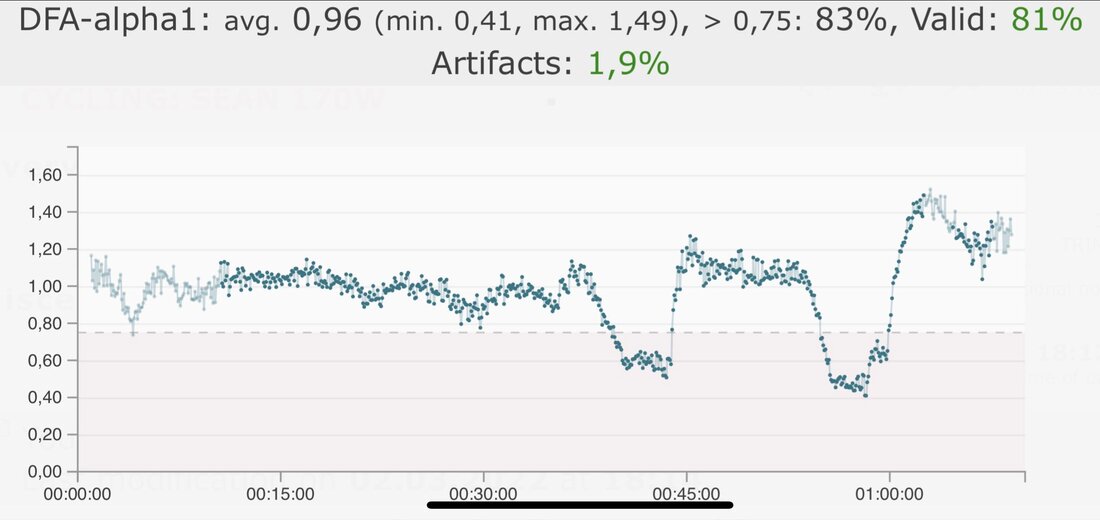
In the first study, this is the published data: We can see how almost all data points are clustered around the same values, apart from an outlier at the bottom, pulling the relationship towards something that appears to be meaningful. The large individual errors are quite clear (10-15 bpm), but the main issue is really how there is no relationship whatsoever here. The fact that all data points cluster around the same values already tells us something, which is that at the group level, more or less we have a similar estimates across participants. This does not mean that there is a link between LT1 and alpha 1 at the individual level. Never confuse similar group averages with something meaningful for the individual. A typical example of a similar scenario is maximal heart rate based on age. Is that a good way to determine individual training zones? No, it is a terrible way as each individual might have a very large difference between their actual maximal heart rate and their age derived maximal heart rate. However, do we have a pretty good relationship at the group level, showing that on average age derived maximal heart rate is similar to measured maximal heart rate? Yes we do. Do you see the difference? What works at the group level does not necessarily work at the individual level. I took the liberty to reproduce the figure above, and remove the extreme values. When we have a strong relationship, removing the extremes should give us more or less the same explained variance, or R2 What happens here? R2 becomes almost zero when removing the extremes. We end up with our cloud of points in the middle, showing clearly how there is no relationship here. In the second study, this is the published data: If there was still any doubt, in this study, also on an homogeneous sample of elite cyclists, many individuals are off by 20+ bpm, one by 50 bpm (!). The universal threshold of 0.75 does not identify the aerobic threshold with reasonable accuracy at the individual level. Note that being off by 20 bpm from the aerobic threshold in either direction is equivalent to either walking or going almost all out. This is not an acceptable error. Issues with hardware, software AND OTHER CONFOUNDERSAll that I have described above makes this section unnecessary. It is already obvious that the method cannot be used to determine the aerobic threshold at the individual level, even under the best conditions possible in terms of hardware, data processing and activity type (indoor cycling). However, we also need to better communicate how unreliable this method is, for reasons that are mostly due to technological limitations, but not only. The data shown above was collected in laboratory settings, often using sensors that provide the entire ECG waveform. Unfortunately, double-checking every heart beat to see if there was an artifact is not practical. Automated methods can at best identify noisy parts in the data, but not resolve the problem. This means that we often end up with inaccurate estimates, especially when exercising outdoors (I hate to break it to a few people, but most of us don't spend every day of the week doing indoor ramps). Additionally, as the data window required to compute DFA is 2 minutes, anything that happens in those two minutes (stopping at a traffic light, breathing differently, talking, etc.) will cause long-lasting variations in alpha 1 that have nothing to do with the intensity of the effort, making the data very hard to read or use for guidance. As an example, below is a session of indoor biking at constant power, with a few minutes of altered breathing in two occasions. If breathing can change alpha 1 by up to 0.4 points during a constant effort, and the whole spectrum between the aerobic and the anaerobic threshold is only 0.25 points (0.75 for the aerobic threshold and 0.50 for the anaerobic threshold), how can we possibly use this for guidance or training intensity assessment? Where does this leave us in terms of assessing exercise intensity?The main problem I have with all of this is that I have seen many people that are new to endurance exercise that would start using DFA alpha 1 to determine with absolute certainty if they are training at the right intensity. This is an issue because given the very high individual variability shown in the published data (let alone the anecdotal evidence I have gathered in the past year), it is clear that we cannot use the 0.75 threshold for this purpose. If you are a veteran endurance athlete, a coach, or scientist, by all means it can be very interesting to look at alpha 1 during exercise (see next point). However, if you are a novice just looking for a method to better manage training intensity, here are some more reliable methods to manage training intensity:
What's next for dfa alpha 1?All of the above is to say really just one thing: there is not such a thing as a universal threshold that we can use to assess or guide exercise intensity at the individual level. It does not exist for heart rate, it does not exist for lactate, and it does not exist for HRV, regardless of what features we are using (standard ones or alpha 1). However, as we know mostly from research carried out at rest, HRV does give us insights on autonomic control of the heart. As such, DFA alpha 1 might be a better tool to look into these dynamic changes, as most other HRV features are of little use when heart rate is relatively high (they are highly suppressed and show no meaningful change even across different intensities, unless we do a maximal test). For example, improved fitness should result in a lower heart rate at a given external load (power or pace). Alpha 1 might also track these changes. On a day to day basis, fatigue is reflected both in exercise heart rate (typically as an acute suppression) and morning HRV (also a suppression). Exercise HRV, using alpha 1, might also capture fatigue. The reason to go through the trouble of using HRV instead of heart rate, typically is due to the higher sensitivity to stress of HRV, and therefore if this was the case also for alpha 1 during exercise, it would be a good reason to try to use it. However, this means collecting data longitudinally, over time, to capture changes in alpha 1 in relation to e.g. other markers of fatigue, exercise performance, etc. - this is a very different approach with respect to the one that is currently being proposed and "validated". It means also throwing out of the window all fixed thresholds, and trying to see how alpha 1 changes over time for an individual, in response to all other factors. Even in the context of assessing exercise intensity, it would be interesting to carry out incremental tests and see if alpha 1 shows deflection points or changes in the signal that might allow individuals to determine their training intensity zones similarly to how we do it with lactate or ventilation data, instead of relying on universal thresholds. These are just some random ideas that might be worth investigating. HRV during exercise might be a valuable tool, but given the evidence accumulated in the past year, we cannot anymore claim that 0.75 is a universal threshold identifying the aerobic threshold. Thank you for reading! The HRV Logger has been validated by Rogers, showing comparable results with respect to Kubios.
Comments are closed.
|
Marco ALtiniFounder of HRV4Training, Advisor @Oura , Guest Lecturer @VUamsterdam , Editor @ieeepervasive. PhD Data Science, 2x MSc: Sport Science, Computer Science Engineering. Runner Archives
May 2023
|
 RSS Feed