cardiovascular endurance and fitness
Moving on, let’s introduce the concept of cardiovascular endurance or cardiorespiratory fitness. Cardiorespiratory fitness (from now on just fitness) is defined as the ability of the circulatory and respiratory systems to supply oxygen during sustained physical activity. Fitness is not only an objective measure of habitual physical activity, but also a useful diagnostic and prognostic health indicator for patients in clinical settings, as well as healthy individuals [1]. Fitness is considered among the most important determinants of health and wellbeing.
In this post, my interest is purely related to performance in sports. So everything that follows should be considered in this context. How is fitness measured today?
Maximal tests
Current practice for fitness assessment is direct measurement of oxygen volume during maximal exercise, i.e. the infamous VO2max test. The gold standard. VO2max is regarded as the most precise method for determining fitness [2]. There are a series of practical limitations to VO2max testing, for example the need for specialized personnel, expensive medical equipment, high motivational demands of the subject, health risks for subjects in non-optimal health conditions (which limits applicability), and so on [3]. Submaximal tests to the rescue Submaxmial tests have been developed already more than 60 years ago to estimate VO2max during specific protocols while monitoring HR at predefined workloads [4]. Basically, these tests rely on the inverse relation between fitness and HR, with higher HR typically associated to lower fitness level and viceversa. Contextualizing heart rate (HR), e.g. determining the HR during specific activities, was a good step forward in terms of practical applicability, compared to maximal tests. However, some limitations still apply: the test needs to be re-performed every time that fitness needs to be assessed, still a pre-defined protocol is required.. etc. fundamental issues
Unfortunately, all the problems just listed are not the only ones. To me, these are not even the main problems. There are much more fundamental issues that seem to be overlooked or ignored in research: the dependency of the VO2max test on the type of test performed, and body-weight normalizations. Let's dig into these issues a bit more in detail.
Exercise protocol
While VO2max is the gold standard, and by definition is the only way to determine fitness level, the exercise protocol performed highly influences results. If you do a bike test and a treadmill test, you’ll get two different results. And differences can be big, with running VO2max typically being higher [5]. One of the reasons is that biking tests are often limited by muscle fatigue. However, such tests are the most commonly performed in research, since they are considered more practical and easier for participants that are not used to do sports (e.g. in more medical oriented studies). How can we measure fitness if the gold standard is affected by such variability? Normalizations One of the major issues with VO2max is the total lack of agreement on body weight normalizations. VO2max is reported most of the times normalized by body weight, however the relation between body weight and oxygen uptake is activity dependent. Again, literature on different normalizations (and allometric coefficients) for activity-specific body weight normalization is inconsistent. Especially when biking, the activity is non-weight bearing, which means the impact of body weight on oxygen uptake is very different compared to weight bearing activities such as running. VO2max categories are based on normalized units (i.e. VO2max/kg), however they don't take into account the type of test performed to obtain VO2max, often over-correcting results. Not-normalizing, while correct in principle, hinders interpretability since tables for different weight ranges don't exist. Let's illustrate this issue with an example. In a dataset I collected during my PhD I had a participant who was very unfit, but also very light. As I mentioned before we can use the HR at predefined intensities as a proxy to fitness level, since higher HR typically indicates lower fitness level. For this participant (highlighted in the following figure), the HR while walking went around 115 bpm, while running as slow as 9 km/h hit more 170 bpm, pointing out the poor fitness level. We can see the data with respect to all other participants of the same sex, on my dataset:
a-c) The HR during different activities measured both in free-living (rest and walking) and laboratory (running) conditions is among the highest for the highlighted participant, pointing out poor fitness level due to the known inverse relation between HR and fitness.
d) As an additional indicator of poor fitness, the highlighted participant shows the lowest physical activity level (PAL) in free living. PAL is computed as total energy expenditure (TEE) divided by the basal metabolic rate (BMR).
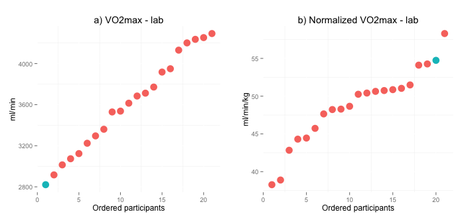
The non-normalized VO2max for this participant was the lowest of the dataset, as we would expect. However, when normalizing by body weight, this participant becomes the second fittest in the entire dataset, with a normalized VO2max corresponding to the "excellent" category according to the classification defined by the ACSM. Obviously, this makes no sense and creates a lot of problems in interpreting VO2max results:
a) VO2max, non-normalized.
b) VO2max, normalized.
This example should convince you that normalized VO2max is far from being a good indicator of fitness or physical performance. Normalizing by body weight makes our unfit participant into an olympic medalist. Is there a better way?
defining the right metric
In my scientific work [6] (currently under review) I also focused my efforts on estimating fitness as assessed by (non-normalized) VO2max, since that’s the parameter currently regarded as the gold standard and accepted by the research community. However in my personal experience as a runner, developer, data scientist and someone passionate about the quantified-self, I wanted to take a step back and re-think the whole concept.
VO2max is highly correlated with body weight, height, age and gender. Additionally, genetics accounts for a big part of our VO2max. As a matter of fact, knowing your VO2max is totally useless if you don’t put it in the context of at least your weight (by normalizing it - with all the problems mentioned in the previous section), age and gender, as you can see from quite common VO2max “tables” that translate your peak oxygen consumption to something human readable, based on rather arbitrary (and inconsistent) thresholds.
What I want to know as a runner, and what I believe most people want to know, is how fit I am, meaning how is my fitness evolving due to training and other changes I am possibly making to my lifestyle. Having this information can help guiding trainings and other life choices by closing the feedback loop with an objective assessment of physical condition. What I wanted to create, was an indicator which you can compare to anyone else, independently of weight, gender and age. An index that you can most importantly compare to yourself over time, longitudinally, regardless of other changes. Additionally, I wanted something that can be acquired and interpreted with minimal effort, without requiring to wear HR monitors 24/7 or during training, but still able to capture some extra information about daily life behavior. More than what a single spot check can do. What I came up with is the Fitness Index, described below. the fitness index
State of the art research showed that combining anthropometric data (i.e. your height, weight, age and sex), together with your physical activity level (PAL) and heart rate (HR) can provide accurate fitness estimation, without the need for laboratory tests. Basically, being more active and having a lower HR, is indicative of better fitness. This is part of the principle behind StayFit and the Fitness Index.
StayFit further adapts the Fitness Index to your anthropometrics data (e.g. weight, sex, etc.) to provide a unique biomarker which is not affected by those parameters, aiming at determining your actual physical fitness beyond what current tests can do. key parameters
The two key parameters behind the Fitness Index, apart from anthropometrics data, are the HR at rest and the PAL. Here I cover in more detail the motivations behind my choices.
Heart rate (HR) at rest The HR at rest is a very powerful predictor of fitness, especially when measured in free living settings. Many studies showed a strong correlation between HR at rest and fitness at a cross sectional level, as well as longitudinally with interventions aiming at improving fitness, consistently showing reduced HR at rest over time. In my experience, the relation gets even stronger when HR is measured in free-living, instead of laboratory settings. For example on the same dataset I previously mentioned, the correlation between HR at rest measured in the lab and VO2max is -0.44 (remember the relation is inverse). However in free living it gets to -0.52. One of the reasons could be that laboratory settings tend to alter the physiological state of a person more, especially at rest, due to the more stressful conditions. Additionally, there's quite a few practical reasons for going this way. A simple HR measurement can be obtained rather quickly using the phone's camera (less than 30 seconds), context can be isolated easily (i.e. performing the test right after waking up), and a good average can be obtained by being consistent, without having to take the measurement every day. Also, HR at rest is not affected by age or gender, making it a predictor that naturally works well across different people. I would like to stress particularly this last point as well as the context importance, which are tightly coupled. Contextualizing HR in free living can provide HR measurements that are better correlated with fitness. For example in my recent work I contextualized HR identifying both low and high level activities, as well as walking speed, and boosted the correlation between free living contextualized HR and VO2max to -0.71 [6]. Another similar attempt I made to contextualize HR during higher intensity activities was for the Armour39 challenge, where I could easily isolate HR at faster speeds since I made an app for runners using GPS. These methods, while able to contextualize HR during higher intensity activities, and therefore potentially being better predictors of fitness, suffer from a problem which I will call "repeatability of context". Context is not all you need. All you need is repeatable context. Here is an example to clarify this point. When I moved to San Francisco from Eindhoven I went from a totally flat city to a city which is basically just hills. "My context" was gone. I was not in the same conditions anymore, for both walking and running, I had to climb up and down, therefore making any contextualization different from what I had before, and unusable for prediction. My HR while running is now affected by altitude changes, while before it wasn't. Fitness estimates made using HR while running would not be comparable. However, measurements at rest are not affected by these issues. What about HRV? While at a cross-sectional level HRV often shows higher values for people in better fitness conditions, this relation often failed to be confirmed longitudinally. Some researcher found a significant increase in HRV features following an intervention [7], while most studies typically report changes in resting HR, but no changes in HRV [8, 9]. Basically making HRV a poor tool to measure changes in fitness, and once again confirming the importance of resting HR. The same was also clear on a recent analysis I did on my data. HRV is a great tool to monitor day-to-day recovery, but HR works better for fitness. Here we can see some of the relations I just covered, between HR, HRV and VO2max in laboratory as well as free living conditions:
Physical activity level (PAL)
Physical activity can be measured in many different ways. The most used metric to quantify physical activity is however energy expenditure (no, it's not steps). Here the link to fitness is quite obvious to understand. If we don't move, we tend to be less fit, if we train hard and therefore burn more energy, we'll get more fit. PAL is simply the total energy expenditure over a day, divided by the basal metabolic rate. It gives an idea of how active you are, regardless of your anthropometrics data (that's what happens when you normalize by your basal metabolic rate). Again, there are trade-offs between practical applicability and accuracy. However, iphones these days are pretty good tools for tracking certain components of activity, and with some extra processing, a decent estimate of calories burnt can be computed. In StayFit, periods of 10 minutes are classified into three clusters: light, moderate and vigorous physical activity levels. Given a cluster, your anthropometrics data and the amount of activity in the 10 minutes, energy expenditure is computed. Then, we get to PAL by normalizing your energy expenditure by your basal metabolic rate.
a-b) HR and non-normalized VO2max in laboratory and free living conditions. A strong inverse relation is clearly visible, especially in free living.
c-d) HRV and non-normalized VO2max in laboratory and free living conditions. The expected positive relation between HRV and VO2max is very weak, almost non-existent in free living, confirming poor predictive power for HRV. putting it all together
Both parameters (HR and PAL) are very important in StayFit. PAL represents how much you move. Easy to interpret and strongly linked to fitness. However, that's only part of the story. HR is the real snapshot on your physiology which can give a unique view of your condition. Two people can have similar anthropometric characteristics (height, age, weight, etc.) and train similarly (therefore similar PAL), but still have different performance and fitness levels. Only by integrating physiological data such as HR and PAL we can try to capture that extra difference. Additionally, both HR and PAL are independent of body size, age and gender, making them good predictors for our new biomarker of fitness, the Fitness Index.
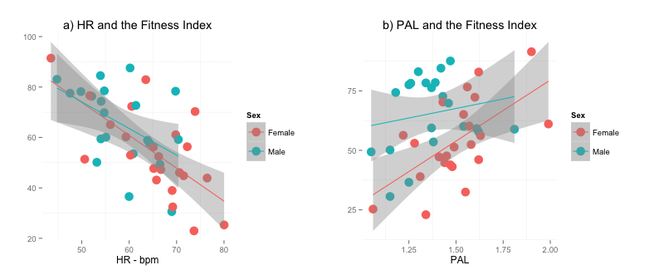
Here is a plot showing the relation between HR, PAL and the reference Fitness Index on my dataset:
a) Negative relation between HR at rest and the Fitness Index, showing higher fitness for lower HRs.
b) Positive relation between PAL and the Fitness Index, showing higher fitness for more active participants. data
Enough with the explanations. Let's have a look at what the Fitness Index can tell us.
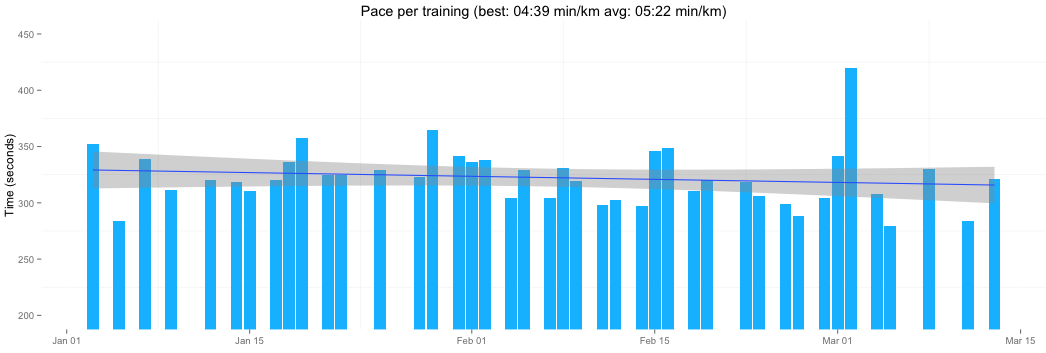
I will show anecdotal evidence that the Fitness Index is able to capture a few things, like building up training towards a race, decrease in fitness due to an injury, and how the Fitness Index can capture fitness level overcoming some of the limitations of other tests, for example when changing environment/context. All that follows is based on data I collected on myself in 2014. Building up training As a runner I struggle in finding an easy way to measure my fitness at any given time. Obviously, I have more or less an idea of how I'm doing with my trainings, however it's very difficult to put them in perspective of what I've done in the past. Am I getting better than last year? Can I finally break the 100 minutes on a half marathon? Even on the shorter term, let's say a weekly basis, it's quite difficult to compare different trainings, sometime I go for intervals, then for a recovery run, a long run, etc. All the metrics I get from mobile apps or watches (distance, pace, etc.) get averaged out within a training (for example even if I go for intervals, I will still warm up slowly for a couple of km) or vary too much between trainings. As a result, they don't really tell me much about how I'm doing. Let's look at a practical case. Between January and March 2014 I was preparing a race. Here is the pace of my trainings:
The previous plot highlights what I was discussing above. Training pace is all over the place if we look at a few weeks of trainings, due to the variability of different training types. Additionally, we can't really see any improvement, due to the fact that each training involves a long warm up and cool down phase, which are bringing the training pace close to my average.
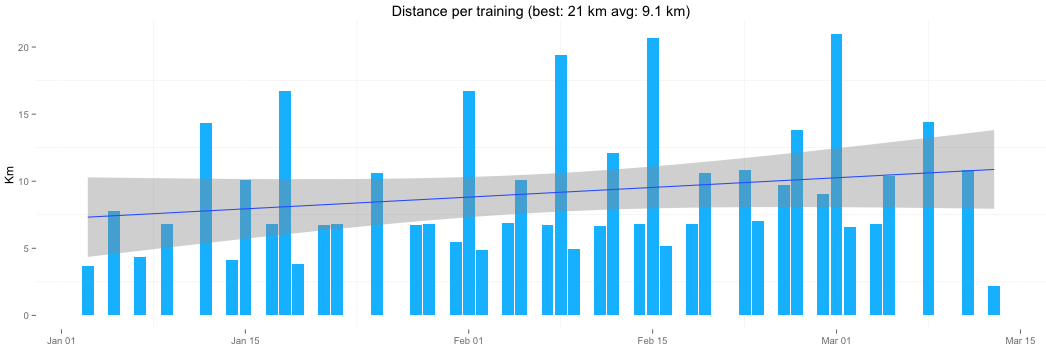
Let's look at the distance:
My pace over two months and a half of trainings. Am I getting better? The regression line seems pretty flat. Am I really not improving?
My training distance over two month and a half of trainings. Here we can see an increase over time.
If we look at the distance, we see an increase over time. However, once again, the variability is high and it's very difficult to understand what it means. Moreover, around February I more or less reached my weekly limit. Does it mean I'm not improving anymore? Most likely I'm doing better and faster trainings, but I can't capture this just by looking at the distance.
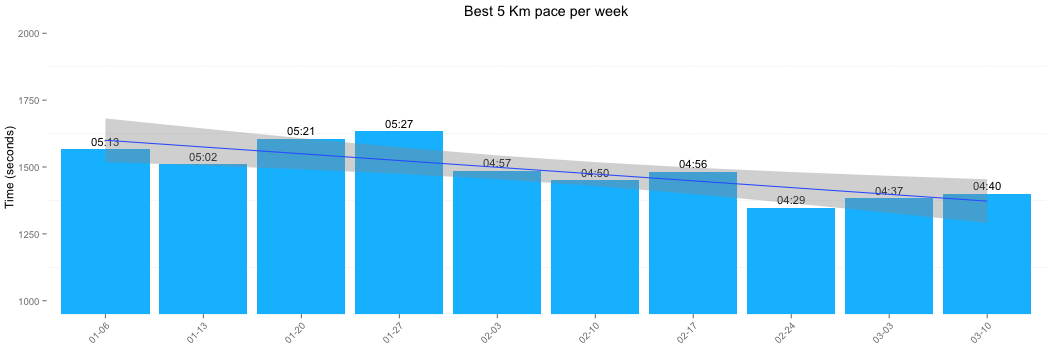
What else can we do with GPS data? Apps and other services typically don't really go beyond what I've just shown, however there is a better way. While the average pace is not telling me much, I'm sure my trainings are getting more intense, intervals are getting faster, etc. So I wrote another script which parses GPS data to scan a complete training and get the fastest 5 Km within a training. I figured that's a good distance to analyze within a training when you are preparing a half marathon. Here is what I get if I plot my best 5 km on a weekly basis (this way we also remove the day-to-day variability, since trainings are more similar between weeks, where we might be repeating the same training cycles):
My best 5 Km pace within a training per week.
Here we go. We can see that I was finally getting better. Some weeks have no 5 km highlights, probably recovery weeks. However, there are clear differences between the beginning of January, and a month after, at the beginning of February. Then again another good improvement closer to march, where I was stable below 4.40 min/km (hint for Runkeeper: copy this).
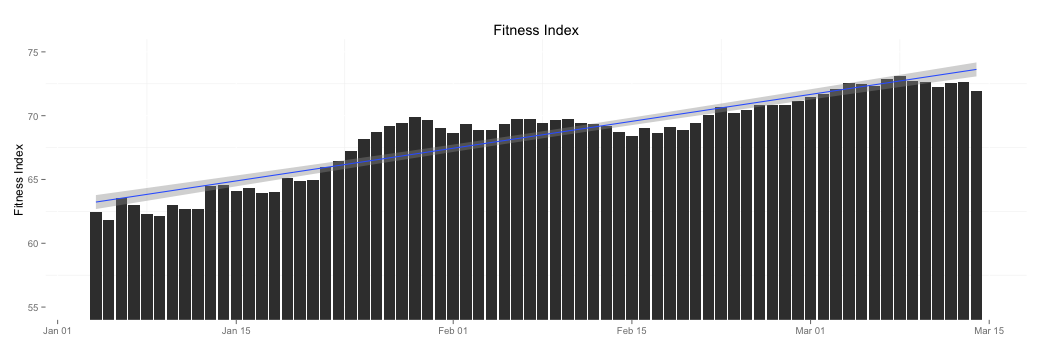
What are the limitations here? Well, first It applies only to running. Secondly, it assumes you live in Holland :) Anything which is not flat will make your "pace analysis" inconsistent and much more difficult to interpret (more on this later). Then, we have practical reasons, even if I put this together, I would need to either download my trainings data and process them after every training (again on the trade-offs between practical applicability and accuracy), or make an app for runners that does it already for me. In the latter case, I would need to run with my phone, which I dislike doing. What about the Fitness Index estimated using my HR and PAL over the same timeframe? Can we capture these changes using StayFit?
My estimated Fitness Index. HR was recorded every morning using HRV4Training, while PAL was determined based on my trainings and daily activity.
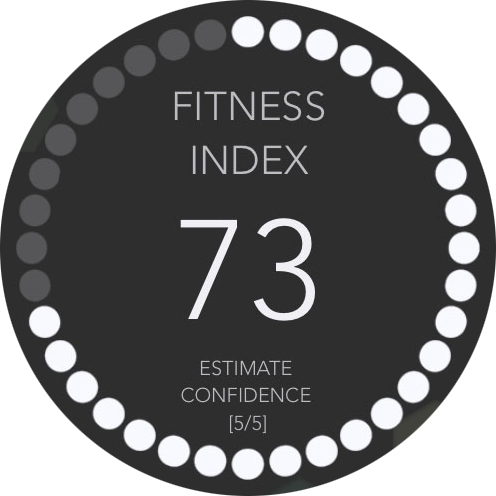
The Fitness Index captures the improvement in fitness level that we expect. Interestingly, the first month of training seems to really make a difference. At the end of january I sort of level up, before making another step forward at the beginning of february. Overall, I went from 62 to 73 points (the Fitness Index is more or less in the range 0 - 100). My current fitness according to StayFit (as of March 2015) is also 73, which means I am at a comparable physical condition (as a matter of fact I've been training quite well for around 2 months, as I was doing last year).
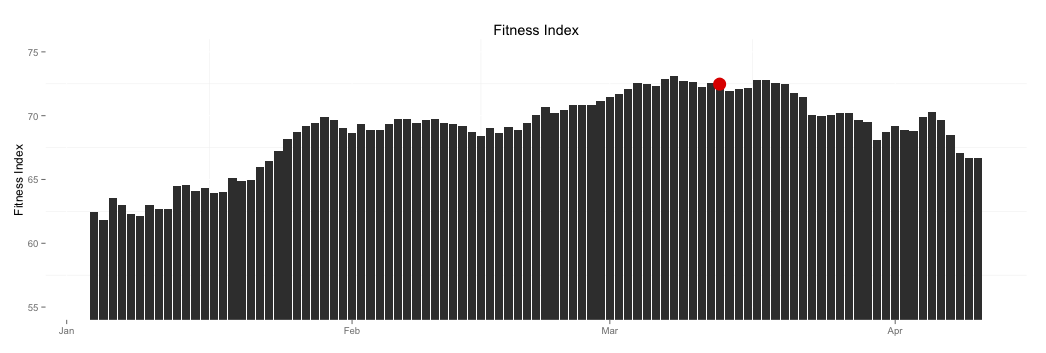
Getting injured What happened after march? I got injured. No race and poor condition until I recovered, plus the usual time it takes to get the condition back. Again, the Fitness Index can capture these fluctuations:
Same as before, this time including 3 additional weeks after my injury, indicated with the red dot.
When pace doesn't cut it
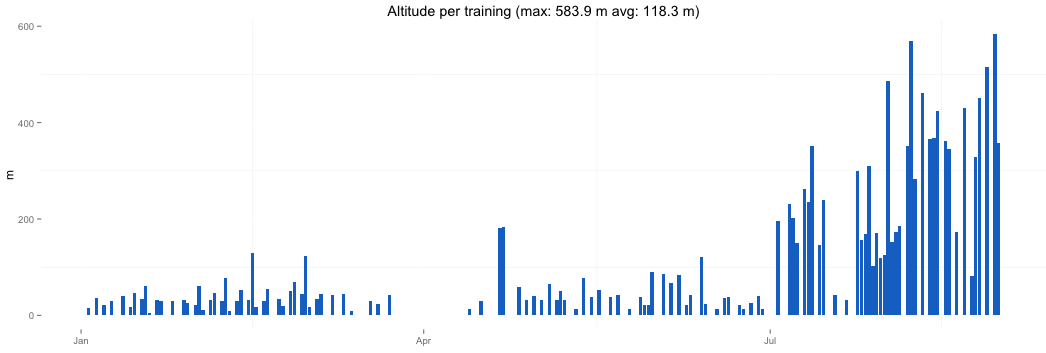
For the last example, I wanna go back to the importance of repeatable context. I showed that by analyzing pace data in a slightly smarter way I could extract more information about my physical fitness. However, this is not always the case. As I mentioned before, in July 2014 I moved from Eindhoven to San Francisco. Running here is a totally different story. Don't believe me? Just look at this altitude plot:
9 months of trainings. Altitude gain. In July I moved to San Francisco. The two easy trainings around mid July were during a trip to Italy.
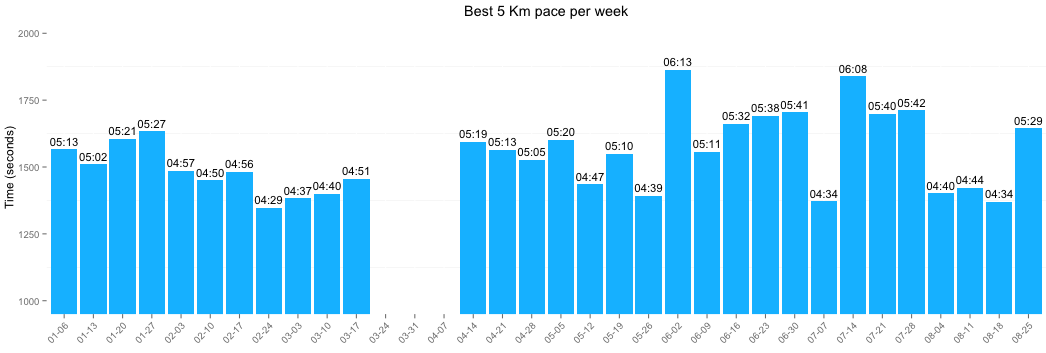
What about my "pace trick"? Can I still use it to see how my condition changed after moving to San Francisco?
Best 5 km pace per week for 9 months of trainings.
What can we see from the advanced pace plot? Clearly, the first week in San Francisco (06-02) was traumatic. Worst pace of the year. What about the rest? The weeks I raced, I have some good (or lower) times, however in general even when analyzing only the best 5 km in a week, my pace is all over the place. I can't get a feeling of how I was doing. Was I really in a much worse shape than the beginning of the year? Most importantly, was I getting better again? Hard to tell.
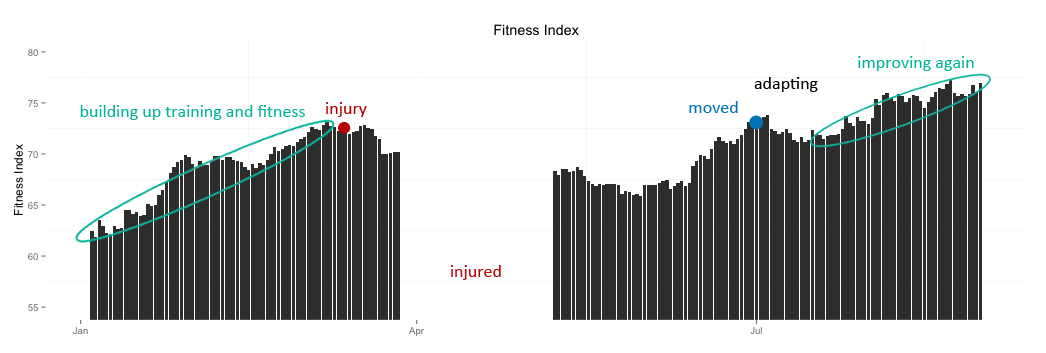
Fitness Index to the rescue:
Fitness Index over 9 months, including an injury and moving.
The Fitness Index gives me more perspective. We already covered the first part, building up training and the injury. Then for some time I didn't record my HR, I guess I was pissed because of the injury. After the injury I started training again, reaching decent fitness levels before I moved. Clearly, I had to assimilate the move (and the hills). It took some adaptation time before I could start seeing my Fitness Index going up again.
Here I don't really have other references (since the pace trick doesnt work anymore due to the change of context), but I do have some evidence that I was actually getting in quite a good shape (for my standards) between July and August. For example, every Thursday I was doing 15 km trainings including a 7.3 km (4M) race in the middle, which I ran in 35:12 at the beginning of July, and in 32:20 at the end of August. That's almost 30 seconds per kilometer faster. Additionally, I ran a couple of times more than 25 Km, which I never did before. It seems the Fitness Index is able to capture my actual fitness level, in terms of my performance while running. At the moment, StayFit uses your HR and estimated PAL over a period of 14 days, together with a few other variables, to estimate the Fitness Index. The 14 days window aims at reducing day-to-day variability in both physiology and activity, to capture a more consistent view. The plots above are computed in the same way. Comparisons across generations I'd like to cover one last point about age. There are physiological variables that naturally change with age, for example maximal HR lowers, VO2max lowers, HRV lowers as well. However, this doesn't mean that you can't perform well or much better than younger people. A good example here is my father. He was quite a runner (full marathon in 2:34, half marathon in 1:13). No way I'm ever going to run like that. Anyways, the point here being that while his VO2max is lower than mine, his maximal HR is much lower than mine and his HRV is lower than mine, he can still kick my ass. The last time we ran together we ran the half marathon in Berlin, he finished in 1:43, eight seconds before me. When I created the Fitness Index I wanted to take into consideration also these cases. Why would all parameters be lower for him if we can still perform at the same level? We should get the same Fitness Index. And that's exactly what happens now, since we have similar HR at rest, we train similarly, and the Fitness Index is corrected for age, so that it doesn't matter if he is 30 years older than me. stayfit app
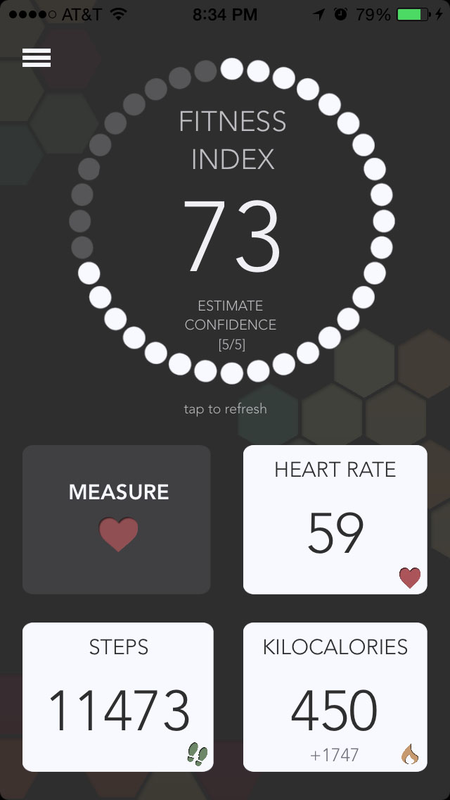
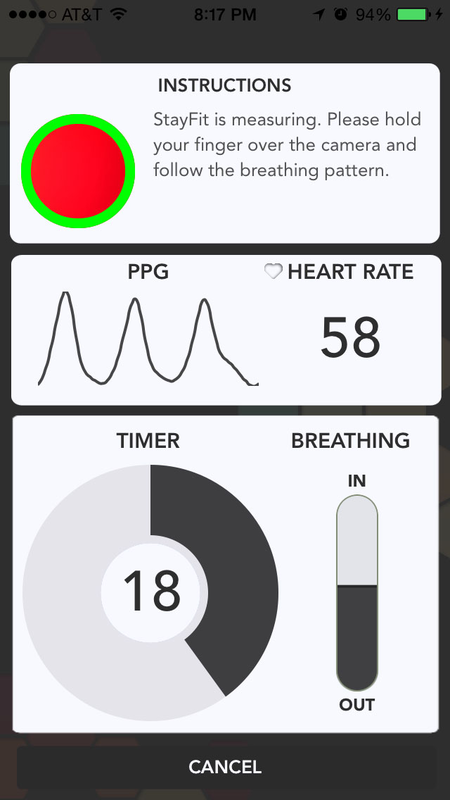
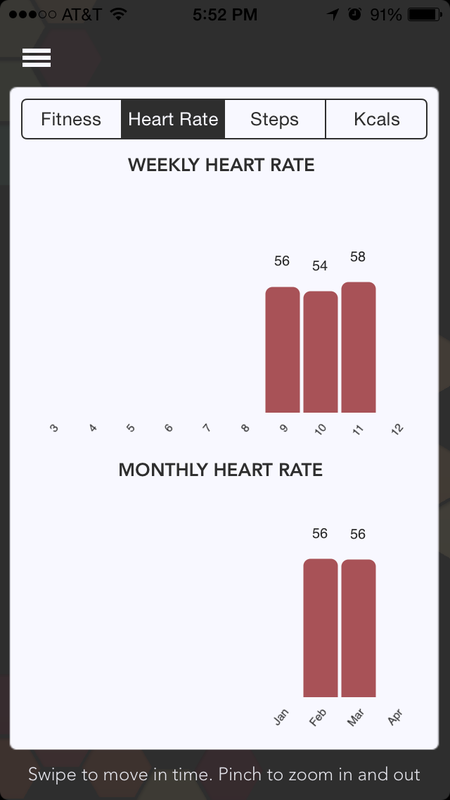
StayFit requires an iphone 5S or later, since it needs the M7 processor to compute your PAL. However, you don't need any HR sensor, since the camera is used to measure HR using PPG. As I described here.
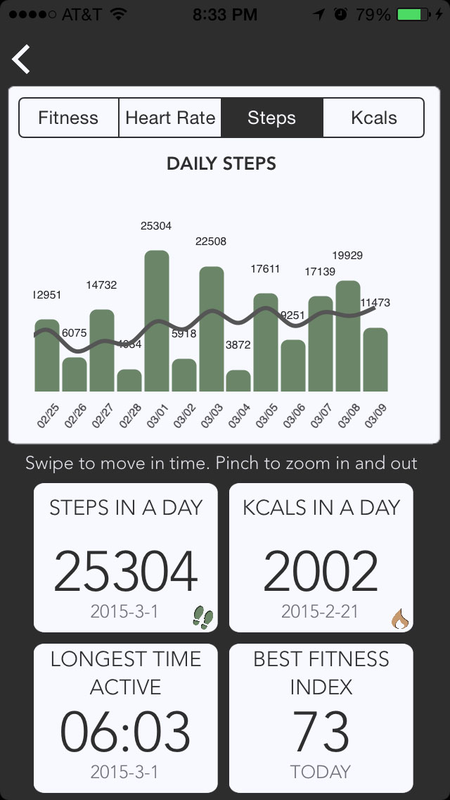
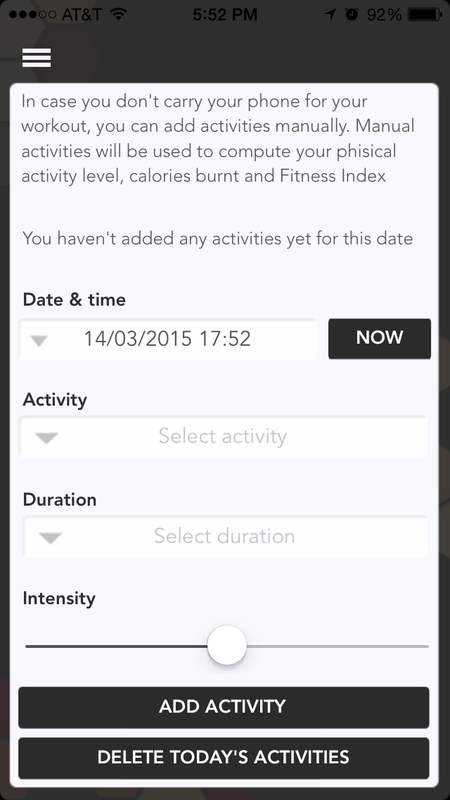
Manual activities An important feature I'd like to cover is the "manual activity". StayFit is most likely going to be used by athletes or sport enthusiast, and obviously not everyone is a runner. As a matter of fact, even if I'm a runner, I'm not a big fan of carrying my phone for training. Since StayFit doesn't really need detailed info about your trainings, and doesn't record GPS data, but simply motion activity, I added the possibility to add your trainings manually. There's plenty of sports to choose from. Kcals will be computed automatically, based on your anthropometrics data, the time you spent exercising and the type of sport. Then, this information will be used to compute your PAL. This way you don't really need to carry your phone to know your Fitness Index. All features: - Fitness Index estimation - PPG based heart rate measurement using the phone's camera - Energy expenditure estimation using state of the art methods combining activity levels and activity-specific models - Step counter - Reports confidence of the estimated Fitness Index - Data export (csv sent by email or via Dropbox) - History, weekly and monthly summaries, moving averages, best records and other stats - Manual activities can be added in case you don't carry your phone for your workout - Data backup and synch on multiple devices what's next?
The Fitness Index is probably not perfect yet. It is a first attempt to create a biomarker which can track fitness level and performance across individuals, as well as longitudinally for one individual. If you have ideas, critics, feedback, please feel free to write me a line. The metric will most likely evolve to become a even better marker of cardiovascular endurance and fitness.
Disclaimer
The Fitness Index is not supposed to be used for medical purposes or to replace current established indicators of cardiovascular and cardiorespiratory health, such as VO2max. The Fitness Index is partially based on the inverse relation between HR at a certain intensity and fitness level. However. No VO2max data was used to build the fitness index. The VO2max data used in this post is used only as comparison to show how the Fitness Index relates to other measures of cardiorespiratory fitness, and was not used for model building. Most of the content of this post is based on personal experience and on what I learnt in years of research in the field. references
[1] D. Lee, E. G. Artero, X. Sui, and S. N. Blair, “Review: Mortality trends in the general population: the importance of cardiorespiratory fitness,” Journal of Psychopharmacology, vol. 24, no. 4 suppl, pp. 27–35, 2010.
[2] L. Vanhees, J. Lefevre, R. Philippaerts, M. Martens, W. Huygens, T. Troosters, and G. Beunen, “How to assess physical activity? how to assess physical fitness?” European Journal of Cardiovascular Prevention & Rehabilitation, vol. 12, no. 2, pp. 102–114, 2005. [3] V. Noonan and E. Dean, “Submaximal exercise testing: clinical application and interpretation,” Physical Therapy, vol. 80, no. 8, pp. 782–807, 2000. [4] P. O. Astrand and I. Ryhming, “A nomogram for calculation of aerobic capacity (physical fitness) from pulse rate during submaximal work,” Journal of Applied Physiology, vol. 7, no. 2, pp. 218–221, 1954. [5] G. Keren, A. Magazanik, and Y. Epstein. "A comparison of various methods for the determination of VO2max." European journal of applied physiology and occupational physiology 45.2-3 (1980): 117-124. [6] M. Altini, P. Casale, J. Penders and O. Amft "Cardiorespiratory fitness estimation in free living using wearable sensors". Submitted to Transactions in Biomedical Engineering. [7] Kiviniemi, Antti M., et al. "Endurance training guided individually by daily heart rate variability measurements." European journal of applied physiology 101.6 (2007): 743-751. [8] Loimaala, Antti, et al. "Controlled 5-mo aerobic training improves heart rate but not heart rate variability or baroreflex sensitivity." Journal of Applied Physiology89.5 (2000): 1825-1829. [9] Boutcher, Stephen H., and Phyllis Stein. "Association between heart rate variability and training response in sedentary middle-aged men." European journal of applied physiology and occupational physiology 70.1 (1995): 75-80.
11 Comments
I like the idea, but it seems hard to estimate the "PAL" without factoring in the heart rate? For example, how do you deal with environmental factors (e.g. cold temperatures in winter)?
Reply
Marco Altini
17/3/2015 11:06:55 am
hey Eric, thanks for your feedback.
Reply
18/3/2015 01:57:25 am
Very interesting stuff, Marco. A couple of questions:
Reply
Marco Altini
18/3/2015 02:28:55 am
hi Alex, thanks a lot for your feedback and for taking the time to go through the post :)
Reply
Teddy
4/4/2015 08:37:51 pm
Hi Marco
Reply
Marco Altini
4/4/2015 10:42:23 pm
hi Teddy,
Reply
11/5/2015 09:23:15 pm
Hi Marco,
Reply
Marco Altini
12/5/2015 06:59:18 pm
hi Simon, thanks for your input. I did not know Phil Maffetone's MAF test. I've just done some quick reading, and it seems to me that the reasoning behind it is similar to some of my thoughts, for example that the way you measure fitness/improvements is by "contextualizing heart rate", i.e. measuring heart rate at a certain intensity or for a certain distance/time - which might be a better idea than going for VO2max, with all the limitations discussed here. I believe, in general, that submaximal tests are the best way to measure fitness, and if you do sports (if I recall correctly you are a biker?) the best way to track fitness is probably to measure heart rate during exercise as suggested by Phil's test. With the Fitness Index I tried to come up with something valid but that does not require exercise (or exercise with a heart rate monitor), while still capturing your levels of activity and physiology at rest. Basically playing with the trade offs of convenience vs accuracy. It would be nice to have some longitudinal measurements to make comparisons. This being said, improvements in fitness that you see "amplified" while exercising, by having reduced heart rate for the same exercise intensity, should also reflect on your heart rate at rest, as well as levels of activity, which is what I try to capture here. The benefit is that at rest changes are less affected by factors like age, but I would assume measuring during exercise is always beneficial.
Reply
George H. Collier
12/6/2015 09:49:27 am
Hi Marco,
Reply
Marco Altini
12/6/2015 10:43:50 am
hi George,
Reply
20/6/2019 10:43:14 pm
Hello Marco! Your Post on cardio vascular endurance is very detailed and informational. Thank you for sharing your blog here with us, keep sharing this type of posts in the future. Cheers!
Reply
Your comment will be posted after it is approved.
Leave a Reply. |
Marco ALtiniFounder of HRV4Training, Advisor @Oura , Guest Lecturer @VUamsterdam , Editor @ieeepervasive. PhD Data Science, 2x MSc: Sport Science, Computer Science Engineering. Runner Archives
May 2023
|


 RSS Feed