|
The topic of EE estimation or physical activity assessment is gaining more and more interest lately, with the release of many activity trackers in the consumer market, some of them claiming higher accuracy due to a combination of accelerometer and physiological data (e.g. Bodymedia, Basis or the Apple watch). However, simply combining multiple signals, without personalization, provides suboptimal results, as I'll show in this post.
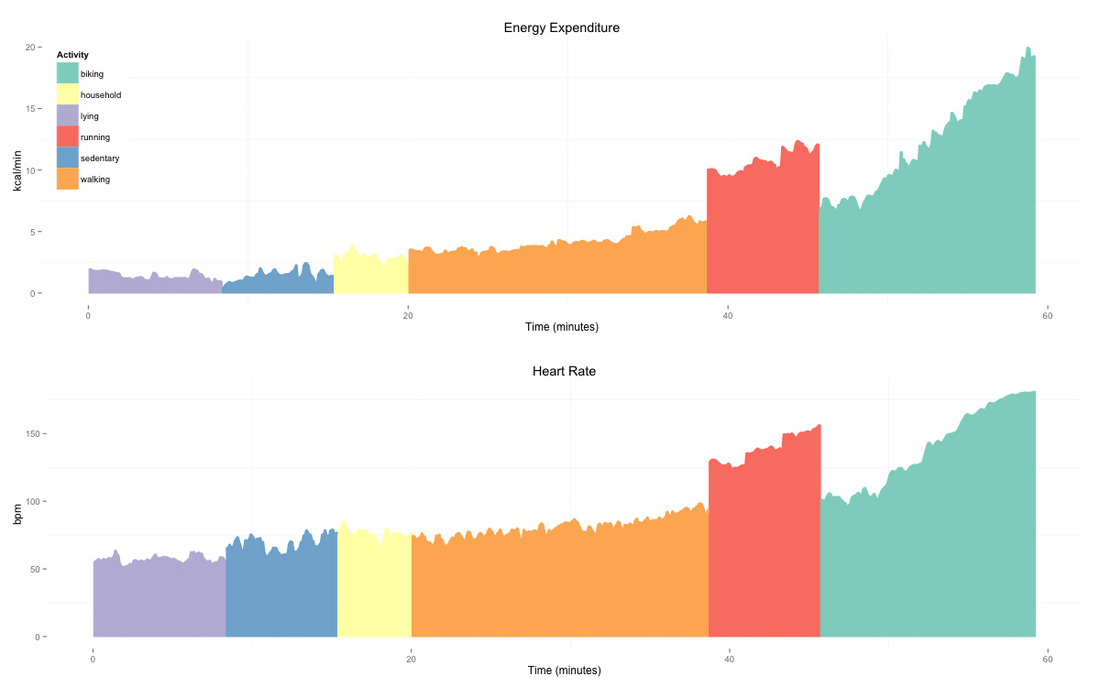
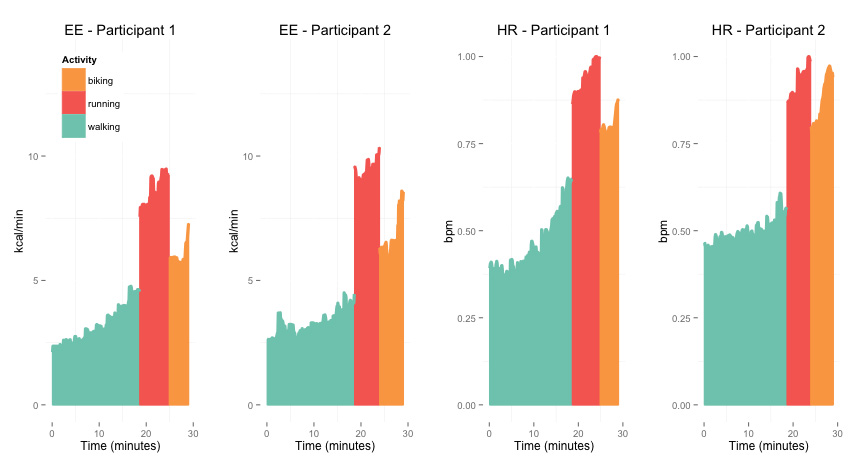
Let's take heart rate (HR) as an example. HR is the most commonly used physiological parameter to monitor physical activity and is getting used more and more with the introduction of many wrist-based HR monitors. HR can be key in providing accurate, personalized estimates at the individual level due to the strong relation between oxygen consumption, HR and EE within one individual. Here we can see how EE and HR evolve during different activities performed by one individual. The signals follow a similar trend. Pearson's correlation coefficient between HR and EE is 0.98, clearly, HR can be used as a predictor of EE.
This post is about machine learning for energy expenditure (EE) estimation. More specifically, I'll show how to model the relation between accelerometer, physiological data and EE using Bayesian models and hierarchical regression.
During my PhD I've been working on developing EE models combining accelerometer and physiological data acquired using wearable sensors. I mainly focused on developing personalization techniques able to normalize physiological data across individuals, without the need for individual calibration.
Figure highlights:
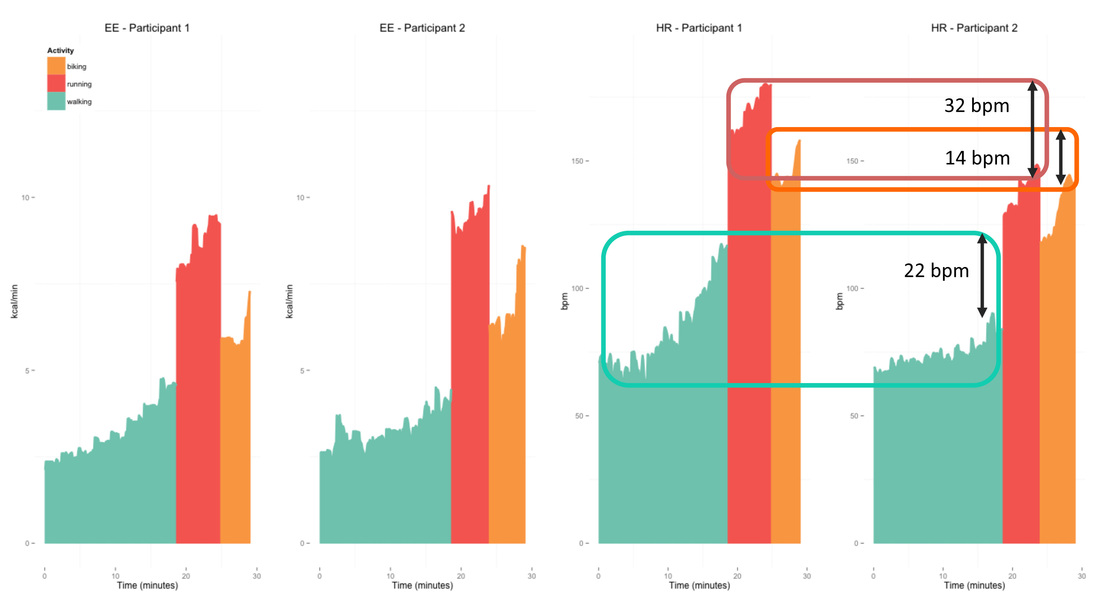
However, this individual-specific relation does not hold across individuals, challenging standard population-based approaches for EE estimation. As a result, individual calibration and laboratory tests are needed to normalize HR. The rationale behind the need for normalization is that individuals with similar body size expend similar amounts of energy during a certain activity, however their HR differs depending on other factors, for example, fitness. Let's look at another example to clarify this point. Here we have walking, running and biking data from two participants, the similar body size (weight P1: 57 and P2: 52 kg, height P1: 166 and P2: 169 cm), results in similar levels of EE for the same activities, as shown in the two plots on the left side. However, the different fitness level (VO2max P1: 2100 ml/min and P2: 3130 ml/min) results in higher HR for the unfit participant, as shown in the two plot on the right end side. Thus, estimation models relying on HR to predict EE will result in underestimations and overestimations of EE.
Figure highlights:
The main focus of my research was then to define methods and models able to take into account variability in physiological signals between individuals without the need for individual calibration. Let's take a step back, and start with the basics. what is energy expenditure?
Calories burnt, or energy expenditure (EE), make up half of the energy balance equation:
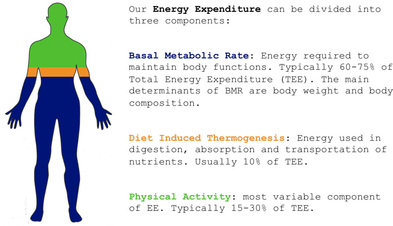
$EE$ is composed of three elements:
While $DIT$ stands for diet induced thermogenesis and is normally accounted for as $10\%$ of the total $EE$, and $BMR$ stands for basal metabolic rate, which is mainly derived from anthropometric characteristics (for practical reasons, since an actual measurement would require an overnight stay in a room calorimeter). Most research efforts focus on physical activity energy expenditure, $PAEE$. This is the component we can impact the most with behavioral change, trying to be more active.
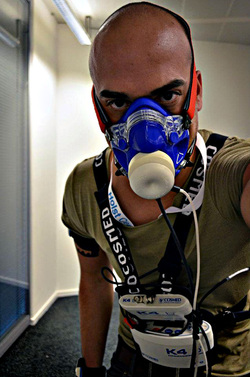
how is energy expenditure measured?
notes on data, notation and performance metricsdata
The dataset used for this post were acquired using the ECG Necklace, a wearable sensor developed by imec to acquire ECG and accelerometer data, on 32 participants with the characteristics. Summary statistics for the participants: 17 female, 15 male, age 24.2 $\pm$ 2.1 years, height 171.8 $\pm$ 7.8 cm, weight 66.1 $\pm$ 10.8 kg, BMI 23.1 $\pm$ 2.8 kg/m$^2$ and $VO_2$max 2995.6 $\pm$ 667.0. For all participants we have not only accelerometer and ECG data, but also reference fitness (VO2max), and reference EE collected during a series of activities of daily living. Activities included: lying down resting, sitting, sitting writing, standing, cleaning a table, sweeping the floor, walking at different speeds (treadmill at at 2.5, 3, 3.5, 4, 4.5, 5, 5.5, 6 km/h) and running at different speeds (treadmill at at 8, 9, 10 km/h). More details can be found in this paper [1].
notation - hierarchical modelsperformance metrics
I will be using Bayesian hierarchical models throughout this post. Hierarchical models fit very well EE estimation since parameters are naturally nested. For example we have many data points per participant, including physiological data and reference EE, and at the same time we have higher level parameters such as anthropometric characteristics (e.g. weight, age, etc.), which are at the person level. Other clusterings which occur, even if non-nested, are for example the different activities performed. Using multilevel/hierarchical models accounts for natural hierarchical structure in the collected data.
I will use the term group level parameters to indicate parameters at the second level of a hierarchical structure. These parameters are the ones influencing first level parameters (i.e. the relation between predictors at the first level of a hierarchical structure and the outcome variable). I'll refer to first level parameters as individual level parameters. In general, I use the following notation, as proposed in Gelman & Hill, 2006 [2]:
All models are evaluated using leave one subject out cross validation, building models using data from all participant but one, and validating models using the remaining participant. The procedure is repeated $np$ times, where $np$ = number of participants, and results are averaged. I will use the Root Mean Square Error (RMSE) as performance metric for $EE$ estimation. The RMSE is a frequently used measure of the differences between values predicted by a model and values actually measured. $EE$ data is not normalized by body weight, and is reported in terms of kcals/min instead of $METs$ since there is a lot of inconsistency with normalization techniques in literature. While it is clear that different activities require different body weight normalizations, and therefore METs are a questionable unit (for example weight bearing and non-weight bearing activities result in a very different relation between $EE$ and body weight), there is no agreement on allometric coefficients. Thus, I will simply consider non-normalized values in kcal/min and include body weight as a predictor for weight bearing activities.
one single model does not fit all (activities)
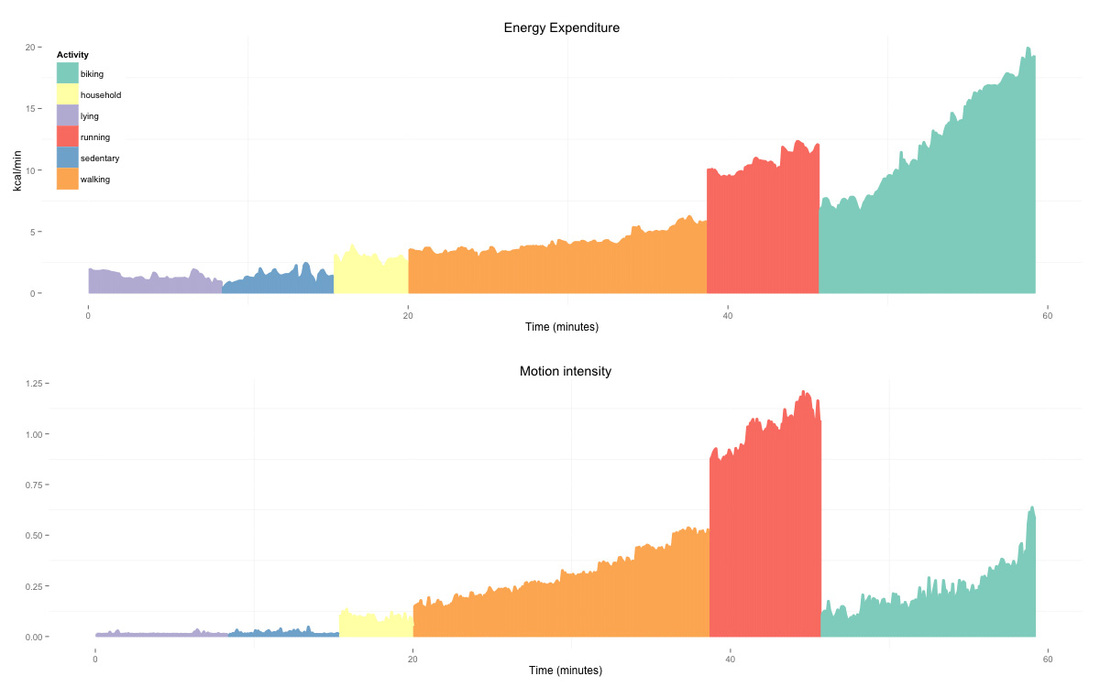
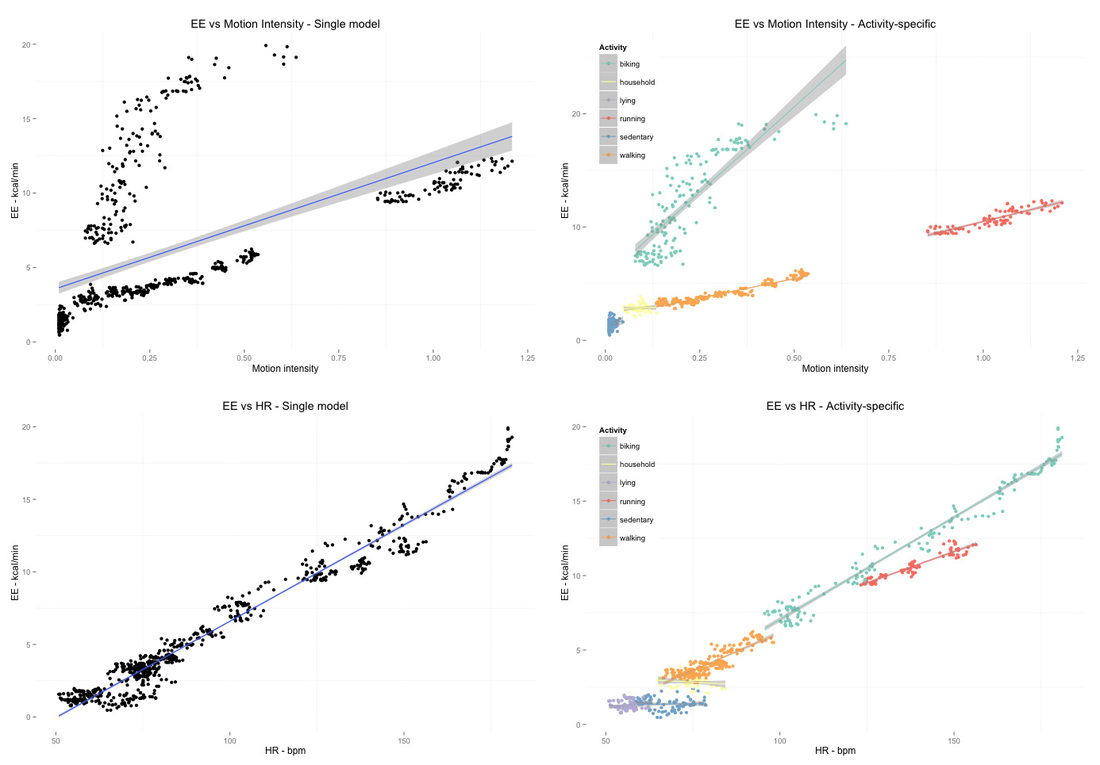
Until a couple of years ago, EE was estimated by regression models using accelerometer data, HR, or a combination of the two, across all activities. Anthropometric characteristics are also part of the equation, given the relation between body size and EE. We've already talked about the strong link between HR, oxygen consumption and EE, which motivates the use of HR data for EE estimation. For accelerometer data, the rationale is that body motion close to the body's center of mass is strongly correlated with EE, at least for weight bearing activities. Let's look at some data. Below we see the relation between accelerometer and EE for one participant over different activities. The relation gets very weak for non-weight-bearing activities, such as biking, while it's reasonably good for walking. The overall correlation coefficient is $0.54$, much lower than the $0.98$ we had for HR data.
Figure highlights:
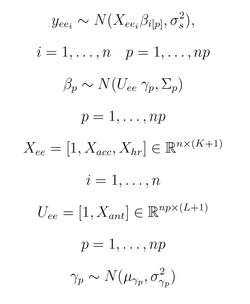
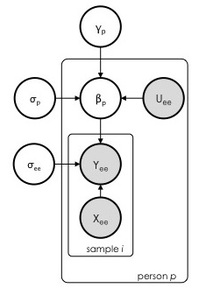
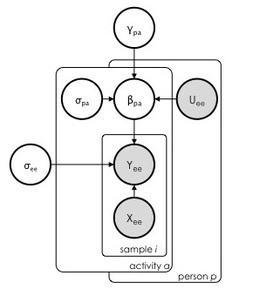
We can take a Bayesian hierarchical approach and model features at different levels. In a hierarchical framework features at the lower level are modeled by features at the higher level, basically this means that anthropometric data impacts the relation between accelerometer data and EE in different people - which is exactly what we want to model. We could imagine, for example, that a person's height and weight influence accelerometer data, and therefore the relation with EE. Without going into too many details, here is the model, where the matrix of individual level parameters $X_{ee}$ can either include accelerometer data, HR data or both. As anthropometric characteristics we are using body weight only, since the age range of our dataset is pretty small, and no clear differences in sex have been shown in literature. On the right we can see the probabilistic graphical model in plate notation, showing how parameters are allowed to vary by group.
The matrix $X_{ee}$ is of dimension $n \times (K+1)$ and includes $K$ individual-level features (i.e. accelerometer, HR, or both), over $n$ data samples. As introduced before, $U_{ee}$ is the matrix of dimension $np \times (L+1)$ and includes $L$ group level predictors controlling the individual level parameters $\beta_{i \lbrack p \rbrack}$. The predictors $U_{s}$ are the anthropometric characteristics $X_{ant}$, in this case \emph{body weight}.
Let's look at the results for different parameters and clustered by activity (even though activity information is not included in the models yet). Here we are looking at errors, so the lower the bar the better:
Figure highlights:
Fitting one single regression model and validating it independently of the participant produces poor results when we try to predict EE, especially for accelerometer only data, since intense activities with little motion, such as biking, can't be modeled correctly. more context
One of the major problems with the previous models is that they assume the relation between accelerometer, HR data and EE is the same during different activities. We can see clearly this is not true:
Figure highlights:
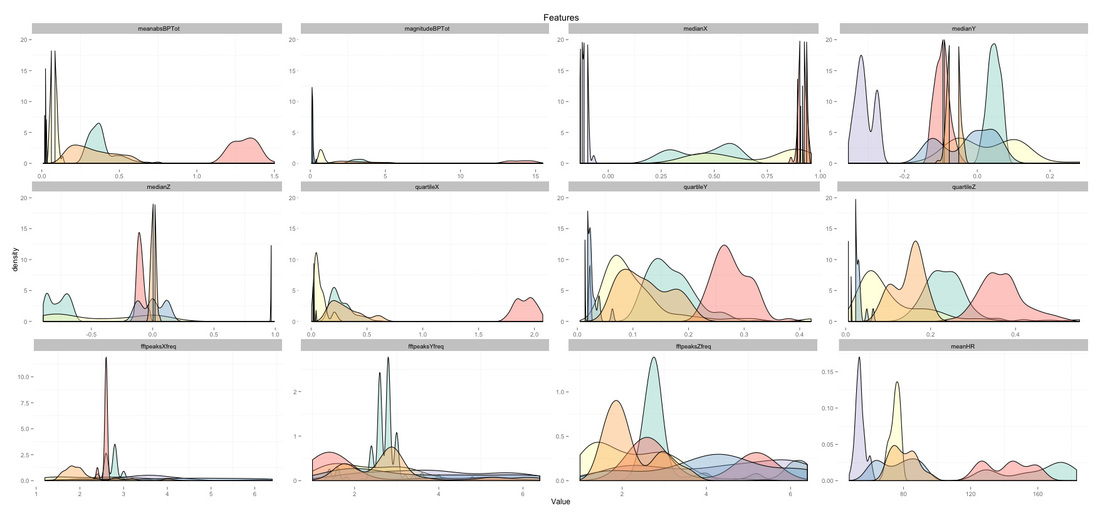
While for HR the relation is already pretty good across all activities, activity specificity is very important for both accelerometer and HR data, as shown on the right plot. A single model mapping features to EE typically overestimates EE for sedentary activities and underestimates it for high intensity ones. A few researchers started proposing activity-specific models, splitting the EE problem into sub-problems [3, 4]. In short, activity-specific models first use an activity recognition algorithm to detect what activity is performed, and then use a EE model tailored on that activity to estimate EE. Going activity specific allows a few other improvements, for example the ability to selectively use HR data - only when the activity is of a certain type. Activity recognition was performed differently by different research groups, personally I prefer to have big clusters of activities which are realistically recognized with high accuracy in free living, for example the following: lying down, sedentary behavior, household/dynamic activities, walking biking and running, instead of classifying 50 activities with low accuracy. The set can be mutually exclusive and will depend on sensor location as well. The activity recognition problem can be framed as a classic supervised learning problem where we have $T$ classes, recognized using accelerometer features (or combined accelerometer and physiological data). Assuming we are interested in recognizing the six clusters of activities just mentioned, here are the features I normally use, a combination of time and frequency domain features which can clearly discriminate between activities (colors are the same introduced before for activities):
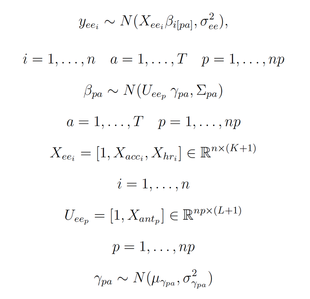
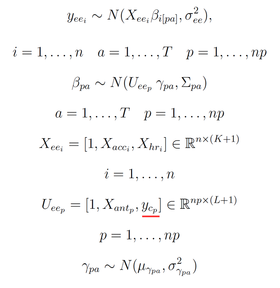
Using an SVM on top of these features provides results in the order of $95/%$ accuracy. Once the activity has been recognized, a different regression model is associated to each class. In a recent journal publication [1] I proposed to extend hierarchical regression models for EE estimation using non-nested groupings for activity and anthropometric data. Here we have a model similar to the previous one, but parameters are allowed to vary not only depending on group level anthropometric characteristics, but also on activity type $T$:
The matrix $X_{ee}$ is of dimension $n \times (K+1)$ and include $K$ individual-level predictors such as HR $X_{hr}$ and accelerometer features $X_{acc}$, over $n$ data samples. $U_{ee}$ is the matrix of dimension $np \times (L+1)$ and include $L$ group level predictors controlling the individual level parameters $\beta_{pa}$. The predictors $U_{ee}$ include anthropometric characteristics $X_{ant}$ (e.g. \emph{body weight}) for $np$ participants. The hyperparameter matrix $\gamma_{pa}$ is of dimension $(L+1) \times (K+1) \times T$, where $T$ is the number of activities.
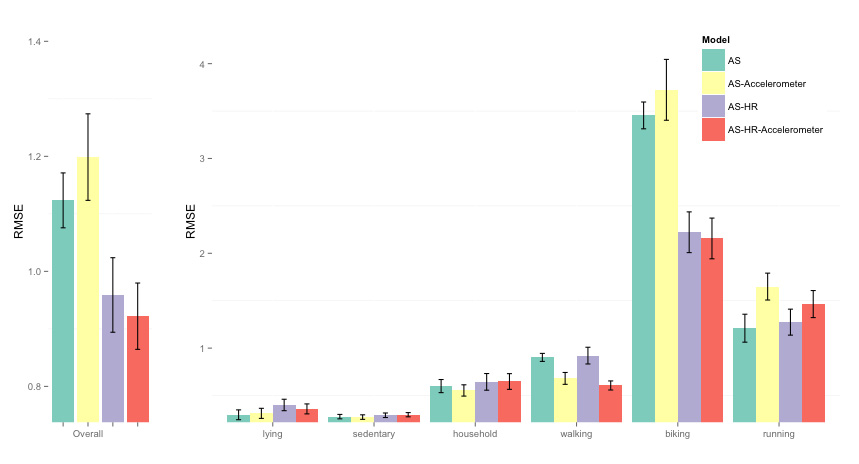
Let's look at how activity-specific models improve compared to single models:
Figure highlights:
A first interesting insight is that simple models combining accelerometer and physiological data do not perform well compared to activity-specific (AS) models. Even when we do not include any feature, but just body weight, as shown by the green bar, RMSE is already much lower than what was achieved by combining accelerometer and HR data with a single model (see results above). Context is key, and it's more important than adding more data streams. For AS models, we see - as expected - that RMSE reduces when including more features. Basically the features allow to capture variations in EE within an activity cluster, since most activity clusters can be performed at different intensities (e.g. walking at different speeds). For low intensity activities (lying, sedentary), features are not necessary, since there is no movement involved, and assigning a static EE value to the activity cluster, depending on the participant weight, is all we need for an accurate estimate [5]. beyond context: personalization
Activity specific models brought many improvements, and are now widely used. However the main problem we had in the early days, with HR showing huge variability across individuals is still there. Breaking down the EE estimation problem into subproblems does not solve anything here. How can we develop models that fully exploit the potential of physiological data across different subjects, without requiring individual calibration?
A way to account for differences in physiological data is to parametrize the model's features or coefficients. I've introduced two ways of doing this:
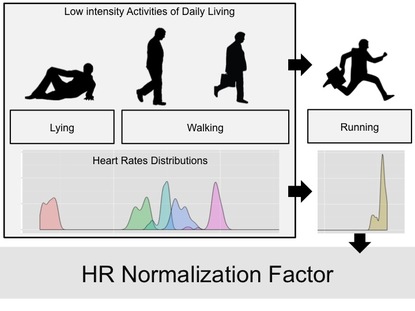
First, we could normalize physiological data using a person's physiological signals under high intensity activities. Basically using the max or range of the signal. However we don't want to have everyone perform individual calibrations at the gym or even worse to have to re-perform these calibrations over and over again because the relation between physiological data and age, fitness, etc. is continuously evolving. However, since we already have context recognition models (activity recognition, walking speed estimation, etc.), we can use low intensity activities of daily living, automatically recognized using different machine learning models, to contextualize HR or any other physiological signal, and then predict what the physiological data during a high intensity activity would be - without having to actually perform that activity. Once we know the "intense" physiological value, we can normalize the signal across individuals.
The block diagram above shows how the system works, by determining HR in specific contexts (e.g. at rest or while walking at different speeds), the HR while running is predicted, without the need for the user to actually perform any intense activity. The predicted HR is used as HR normalization factor. If we look at the data I showed at the beginning, where HR is shown to be very different between the two participants with different fitness level, after this kind of normalization, we have very similar levels of normalized HR, and therefore EE estimation will be much more accurate:
Figure highlights:
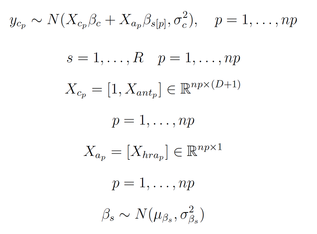
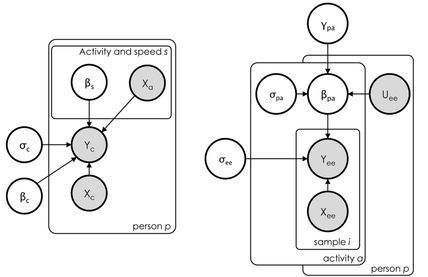
Alternatively, we can use a more elegant solution. My latest work [1] focused on using hierarchical Bayesian models. Since we know what is the cause behind the need for individual calibration, i.e. differences in fitness, we could estimate fitness level and then model it as a group level parameter in a hierarchical model. In this way fitness level directly influences the relation between HR and EE, without the need for explicit HR normalization. This is the approach I'll use here. Our hierarchical model looks pretty much the same, with the main difference that this time we include fitness level among the group level predictors. Additionally, we have another model to estimate fitness ( $y_{c_p}$ ), which uses HR during low intensity activities commonly performed by everyone, such as walking, and anthropometrics data, as predictors:
where the matrix $X_{c_p}$ of individual level attributes is of dimension $np \times (D+1)$ (i.e. \emph{body weight}, \emph{height}, \emph{age}, \emph{sex}). The associated parameters $\beta_c$ do not vary. Contexts $s$ are a set of combined activity types and walking speeds (e.g. \emph{walking at 4 km/h}, etc), which control the parameters $\beta_s$ for the attributes $X_a$. $X_a$ consists of HR during predefined contexts $s$ (indicated as $X_{hra_p}$), and is of dimension $np \times 1$. $\mu_{\beta_s}$ and $\sigma_{\beta_s}$ indicate hyperparameters for group level parameters $\beta_s$. Activity type $a$ is recognized from a set of $T$ activities $A = {a_1,\dots,a_t}$, using for example an SVM. Graphical models in plate notation:
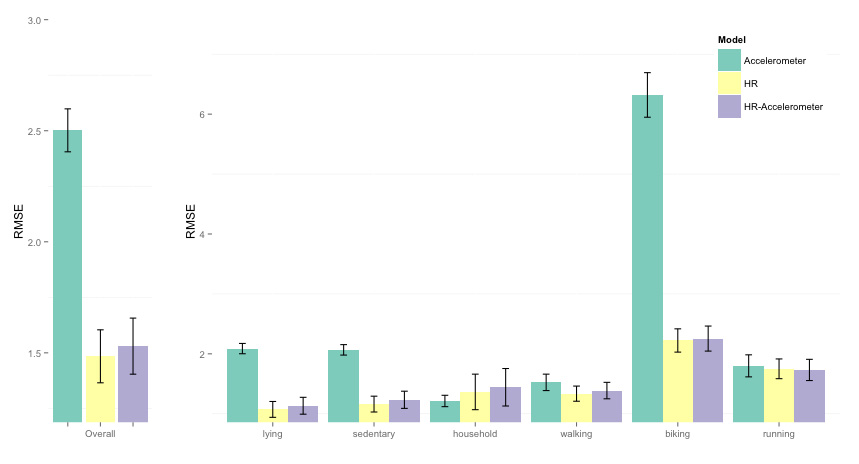
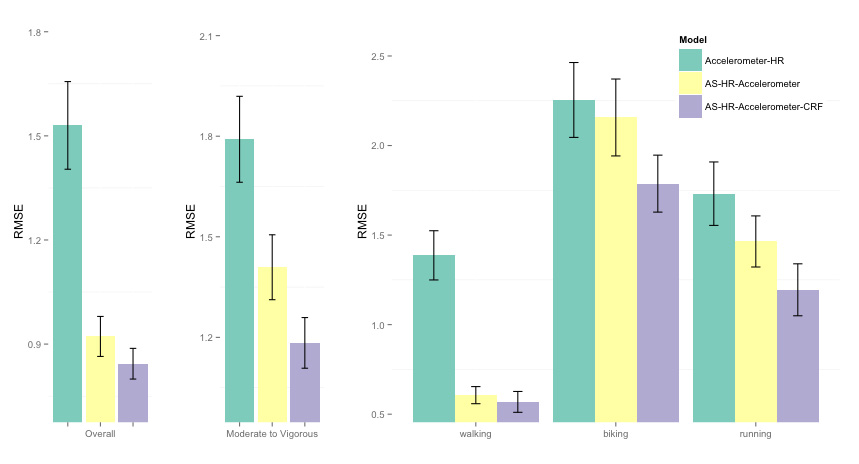
I won't spend time here on fitness estimation, which is quite a topic per se. The principle is used by many sub maximal fitness tests, where HR at a certain intensity is used as predictor - together with other variables - to estimate VO2max. The difference is that by using context recognition algorithms, there is no need to perform lab tests or specific exercises. We can take the HR while walking at certain speed as our sub maximal HR and then predict VO2max. Finally we include fitness as group level parameter and predict EE. If we compute results with the usual leave one participant out cross validation, we obtain the following RMSE:
Figure highlights:
takeaways
That's all. Hopefully this blog post gives a decent overview without having to dig into too many papers. Main points:
references
[1] M. Altini, P. Casale, J. Penders, O. Amft. "Personalized cardiorespiratory fitness and energy expenditure estimation using hierarchical bayesian models" accepted for publication in the Journal of biomedical informatics. 2015.
[2] A. Gelman and J. Hill. Data analysis using regression and multi-level/hierarchical models. Cambridge University Press, 2006. [3] A. G. Bonomi. Improving assessment of daily energy expenditure by identifying types of physical activity with a single accelerometer. Journal of Applied Physiology, 107(3):655-661, 2009. [4] E. Tapia. Using machine learning for real-time activity recognition and estimation of energy expenditure. In PhD thesis, MIT, 2008. [5] M. Altini, J. Penders, R. Vullers, and O. Amft. Estimating energy expenditure using body-worn accelerometers: a comparison of methods, sensors number and positioning. IEEE Journal of Biomedical and Health Informatics, (99):1, 2014. [6] M. Altini, J. Penders, and O. Amft. Personalizing energy expenditure estimation using a cardiorespiratory fitness predicate. In Pervasive Computing Technologies for Healthcare (PervasiveHealth), 2013 7th International Conference on, pages 65-72. IEEE, 2013. [7] M. Altini, J. Penders, R. Vullers, and O. Amft. Personalizing energy expenditure estimation using physiological signals normalization during activities of daily living. Physiol Meas, 35(9):1797, September 2014.
0 Comments
Your comment will be posted after it is approved.
Leave a Reply. |
Marco ALtiniFounder of HRV4Training, Advisor @Oura , Guest Lecturer @VUamsterdam , Editor @ieeepervasive. PhD Data Science, 2x MSc: Sport Science, Computer Science Engineering. Runner Archives
May 2023
|


 RSS Feed