|
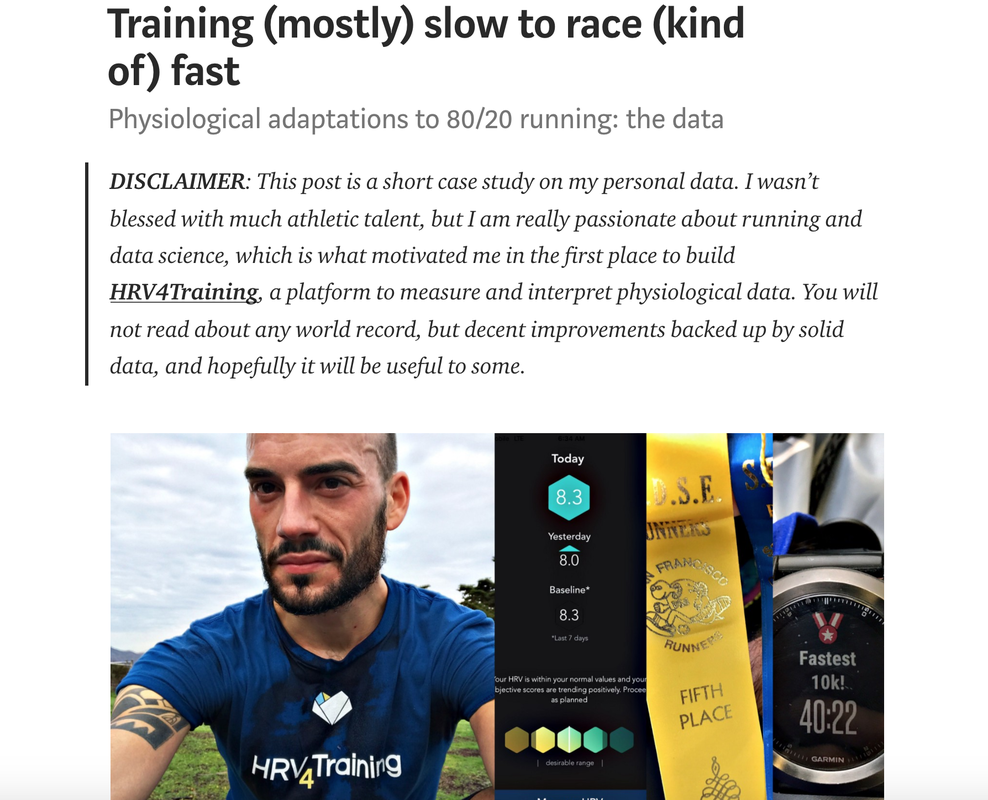
In this post, I’d like to show how we can monitor progress (or lack thereof) in endurance sports using tools such as aerobic efficiency and cardiac decoupling analysis in HRV4Training Pro. I will also show how training adaptations resulting from different training stimuli can be captured by these tools better than using standard training load analysis metrics such as chronic training load. I hope you'll find it helpful. 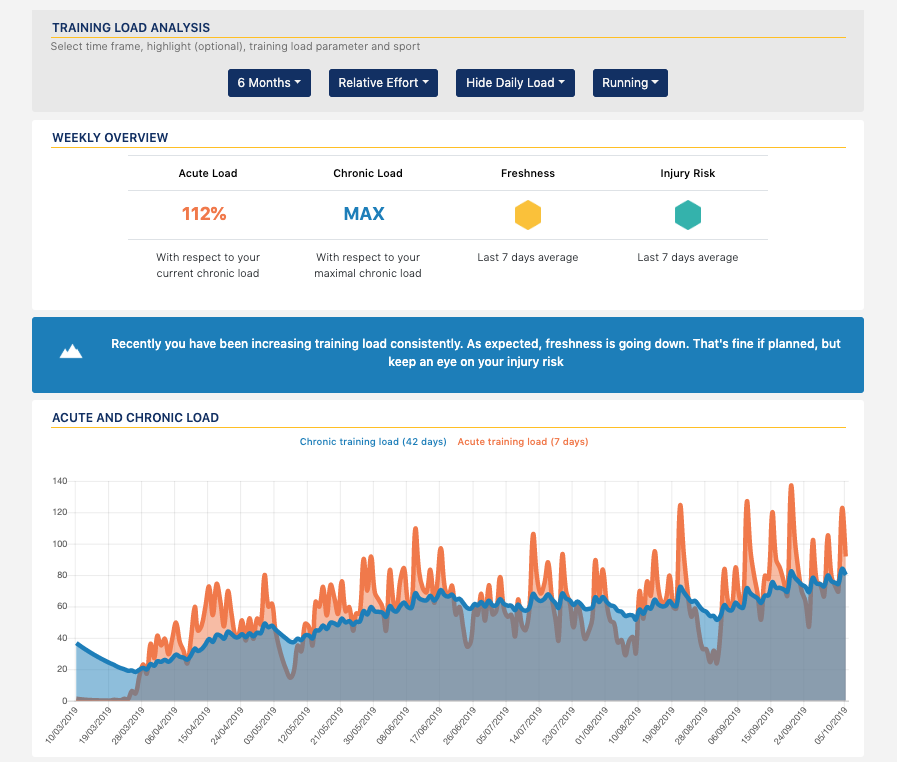 James Witts wrote a piece on polarized training (or 80/20 running) for the June 2019 issue of Runners World UK. My case study was featured, you can find it below. For a deep(er) dive into my data from a few years back, at this link. 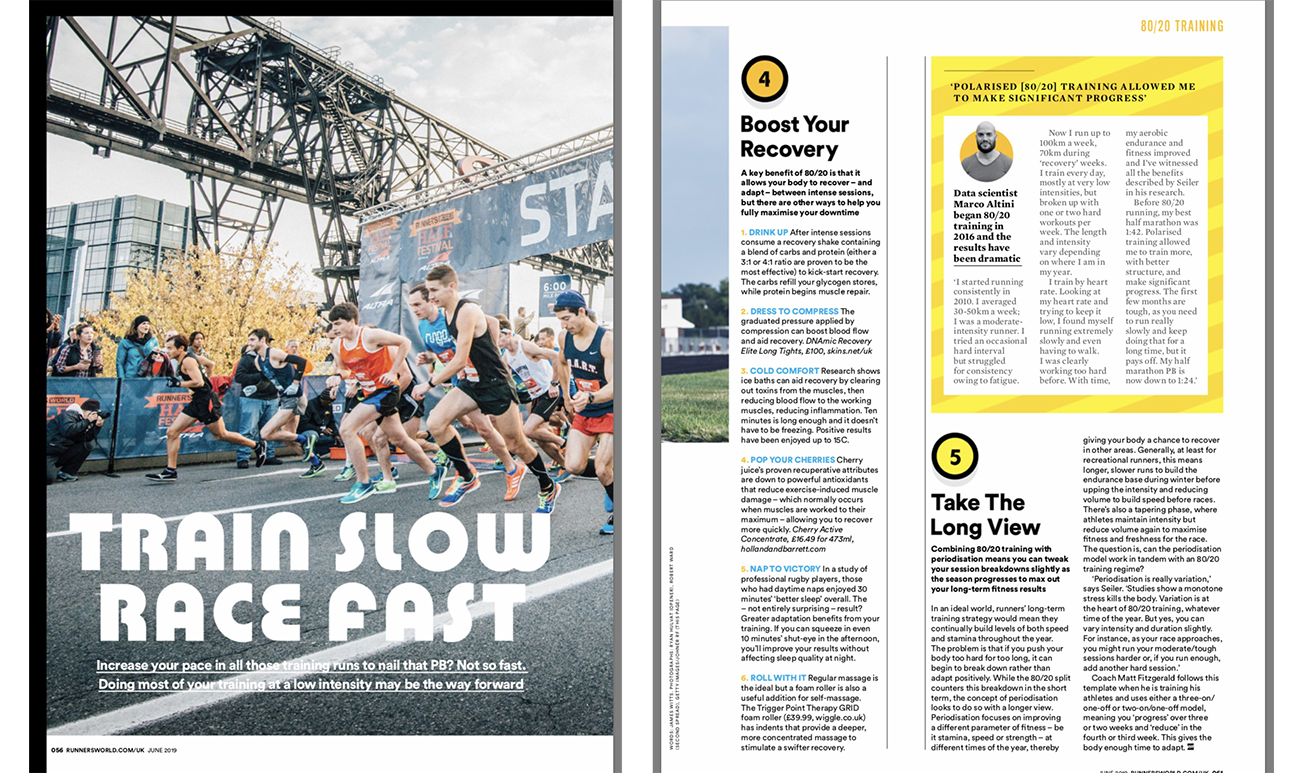 In this post, I'd like to show some data to highlight a few important aspects when analyzing your heart rate variability (HRV) data. In particular, I'd like to cover some misconceptions about the relationship between training and HRV as well as the importance of lifestyle and psychological aspects (context!). We'll use my own data collected between January and April 2018, so 3 months in which I went from best shape of my life to injured and then back to training regularly post-injury, but in poor shape (detrained). We'll look at:
I hope this case study can be a good starting point to identify useful ways to look at your data using HRV4Training Pro.  In this post we’ll show two methods we have implemented in HRV4Training Pro to let you easily track changes in aerobic endurance while preparing a running or cycling event, so that you can analyze your progress:
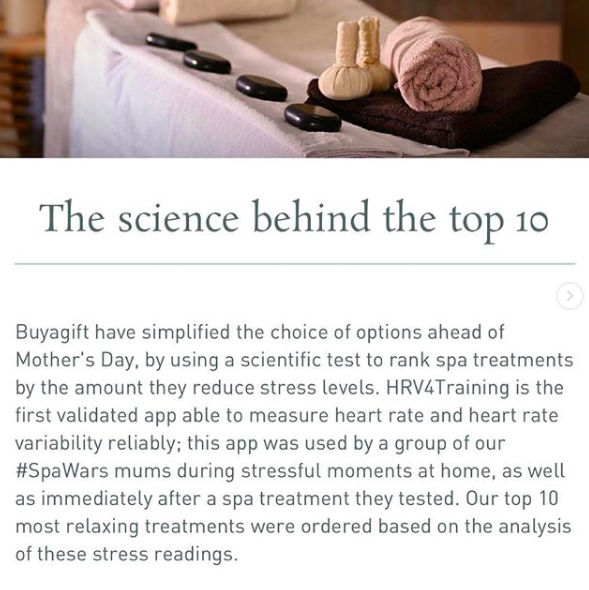
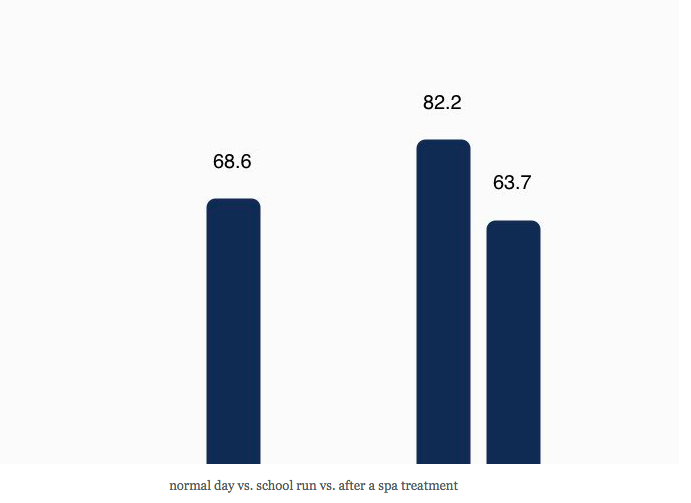
Using these two methods and analyzing changes systematically over time with respect to your historical data, it should be easy to track improvements (or lack thereof) over time and make meaningful adjustments to your training plan. Learn more at this link. 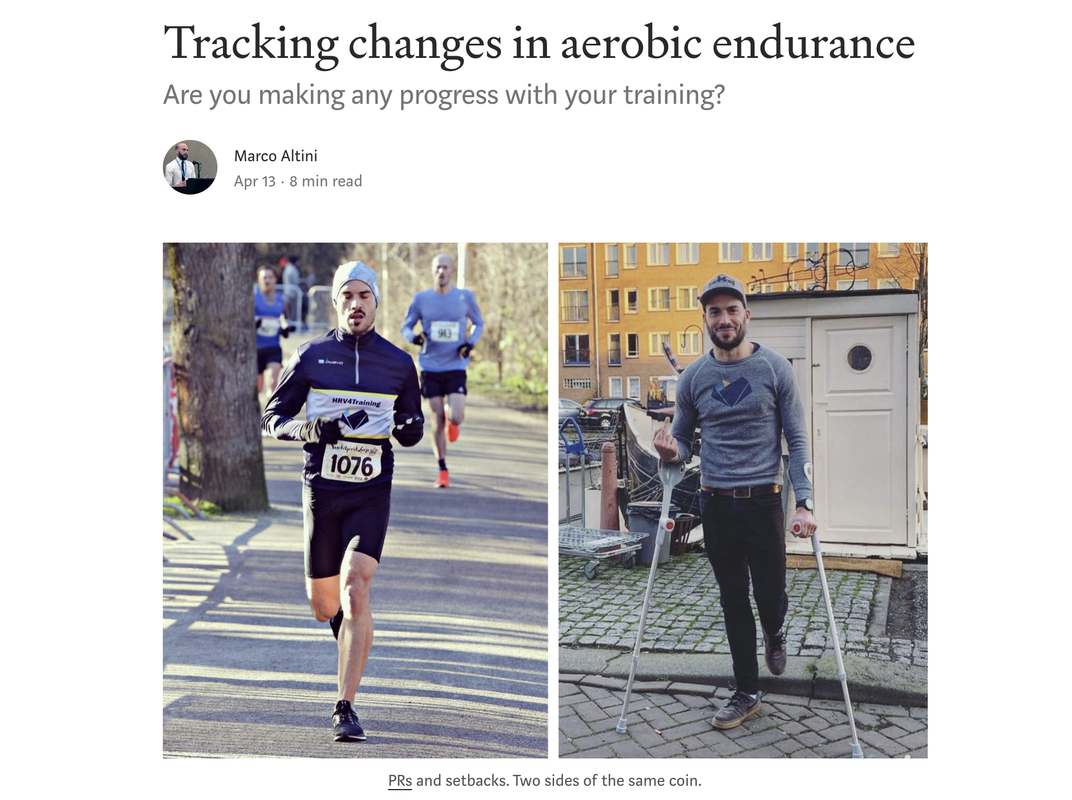 In this post, we go over the 12 weeks leading to Serena's first marathon. We'll see how HRV data can be used to analyze positive adaptations (increasing or stable HRV baseline) and to determine when to hold back if necessary (HRV baseline below normal values, or maladaptation detected). We'll also see how to analyze training intensity distribution and how to determine race pacing strategy using HRV4Training Pro. As always, while this post is about data, there is no use in data without common sense. Data is not here to replace our brain. Data is here to help us improve our understanding of our body and perception of stress and effort - something we are really bad at, especially as recreational athletes. Hopefully, the tools we have developed as well as this case study will help you to learn more about how you respond to stress and to manage things better. Thank you again Serena for working with me in these three months and congratulations again on your sub-4 marathon. Train smart, run faster 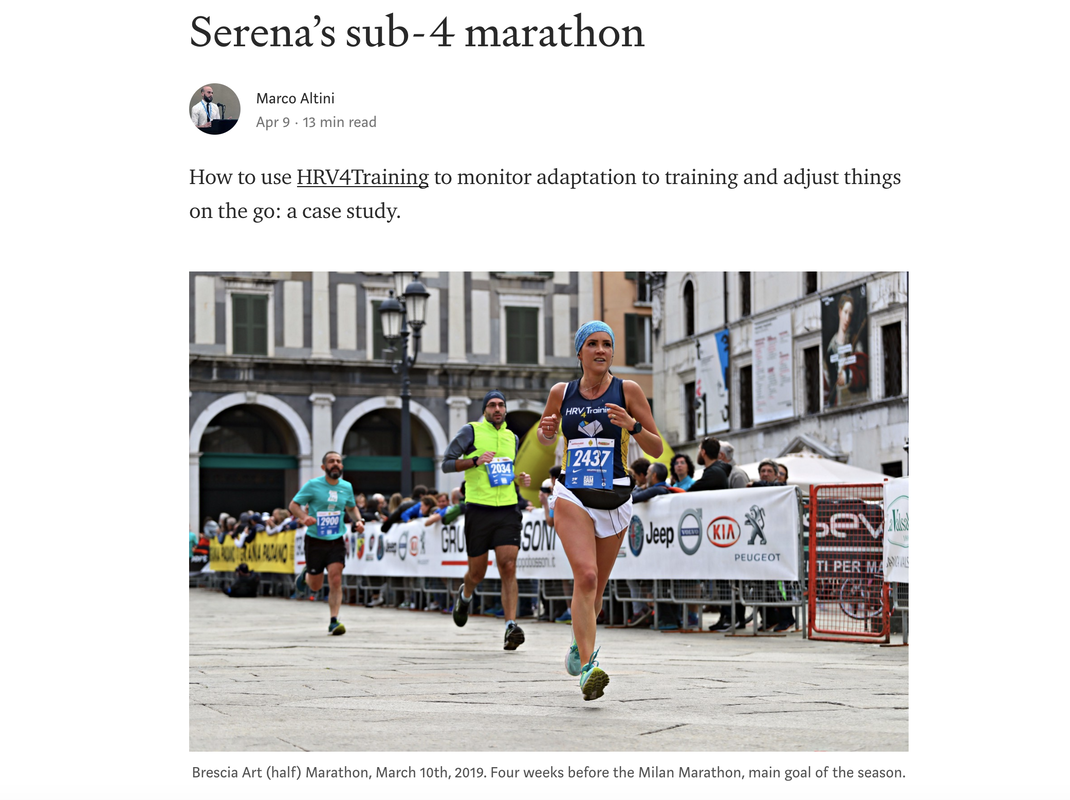  Today's blog post is about a fun project I had the pleasure to take part in thanks to Dan Plews and Rob Arkell. The project was ran by buyagift, and the idea was to determine which spa treatment is more relaxing, so that you can gift the most relaxing treatment for Mother's Day. Obviously, we used HRV4Training to assess physiological stress. HRV4Training is the first and only validated app that can measure heart rate variability (HRV) without requiring anything more than your phone, and hence it provides an easy way to measure stress non-invasively. While we normally work with athletes, our body responds to training and lifestyle stressors in the same way (which is why we cannot look at just one or the other), and therefore by using HRV4Training we could capture stress (and relaxation) resulting from a specific treatment, in an objective way. What did we do?Ten UK mummy bloggers were each given a spa treatment and asked to measure their stress levels – or Heart Rate Variability (HRV) – once during the most stressful moment of their day and again after their spa treatment. Buyagift then compared the different readings to determine the most improved stress rates and unveil which spa treatments truly reduce stress levels the most.
The experiment setup is quite similar to what we would do in a pre / post experiment in clinical settings, trying to figure out the impact of a particular stressor or relaxation exercise (e.g. meditation, or in our case, a spa treatment) - what we also call acute HRV changes. Dr Daniel Plews, Physiologist and Buyagift’s stress experiment consultant comments: “The survey reveals that mums need to take more time to relax as too little sleep and too much stress can have serious long-term physical and mental health implications. As 4 in 5 families don’t know which treatment to get their mother, this experiment was designed to reveal which treatments help mums de-stress the most by analysing mums’ stress levels. We did this by measuring HRV, which is an accurate, non-invasive measurement of the variation between consecutive heart beats intervals. It reveals signs of physiological stress, as HRV is typically higher (more variation between heart beats) during relaxing activities and decreases (less variation between heart beats) during stressful activities.”
I have helped Strava developing their current Relative Effort, a metric used to quantify training effort, combining intensity and duration. You can read Strava's official launch blog post here as well as an interview I gave here (the website hosting the interview is actually not available anymore, hence I am linking below only the official Strava blog mentioning this work).  What time did you go to bed? A simple Bayesian model to improve user experience in HRV4Training25/3/2016 See the original post on HRV4Training's Blog at this link. 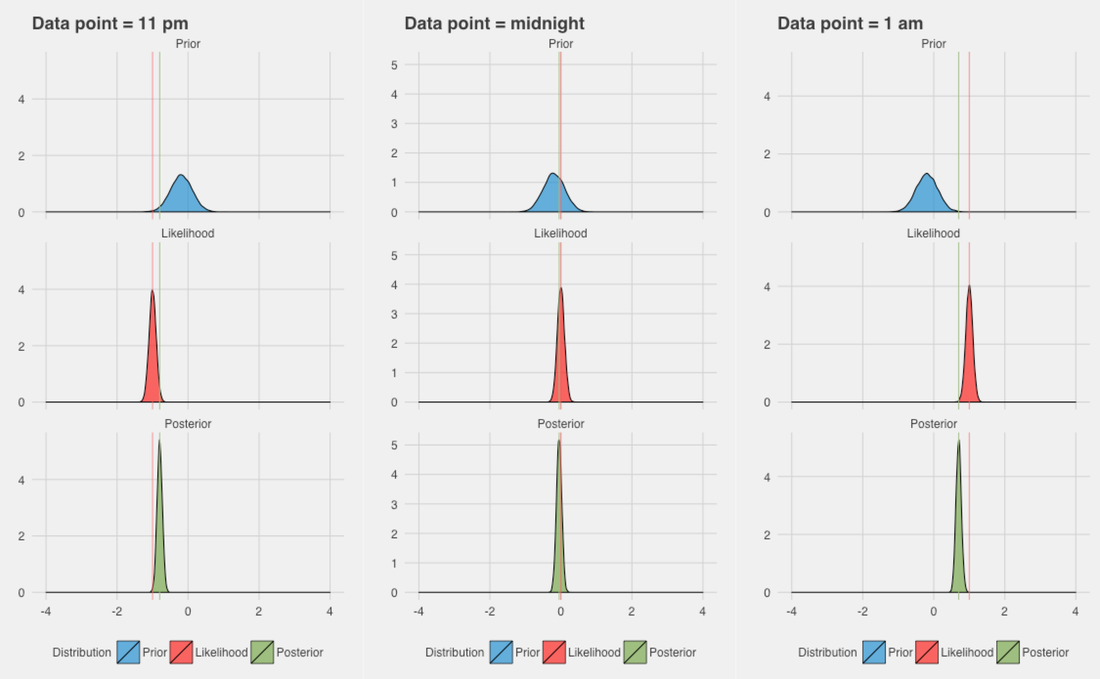
In preparation for the Quantified Self Europe conference I went over the past 15 months of physiological (HR/HRV) and contextual (work hours, travel, sick days, training, fitness, etc.) data I collected, and found very interesting relations between my HRV and life stress. I blogged about it on medium, you can find the article here:
Parameter estimates for regression: least squares, gradient descent and monte carlo methods22/8/2015
[data and R code for this post are available on github]
In this post I will cover three ways to estimate parameters for regression models; least squares, gradient descent and Monte Carlo methods. The aim is to introduce important methods widely used in machine learning, such as gradient descent and Monte Carlo, by linking them to a common "use case" in the different data science communities, such as linear regression. Regression is one of the first prediction methods invented, and the three approaches I will be discussing, are typically used by three different communities. Least squares is probably the most common method, mainly employed by frequentist statisticians and also used as the default method for many easy to use packages in R or Python (e.g. the lm function in R). Gradient descent is the machine learning approach to the problem. My favorite resource on the topic is the famous machine learning course by Andrew Ng on Coursera. In machine learning, the overall approach to problem solving and prediction is rather different compared to more classical statistics, even though it heavily relies on statistics (check out this answer by Sebastian Raschka on the origins of machine learning, I think it makes my point clear). I think one of the reasons why Andrew Ng uses gradient descent in the first place, instead of other methods like the least squares, is probably that he wants to stress the importance of the method in the machine learning community. By using gradient descent, he highlights how in machine learning it's often more important to approximate a solution by defining an iterative procedure able to efficiently explore the parameter space, instead of obtaining an exact analytical solution. Finally, there is the Bayesian way of doing things. Monte Carlo methods are powerful tools to explore the parameter's space and obtain the full posterior distribution, instead of just point estimates. This is something that requires a bit more introduction and explanation, and while I tried to do so in the remaining of this blog post, this is certainly far from being a comprehensive resource on Bayesian modeling. For the ones that want to dig deeper into regression and Bayesian approaches I would suggest reading Gelman's book on hierarchical modeling, one of my favorite resources in the field.
[For this analysis I used the term/preterm dataset that you can find on Physionet. My data and code are also available on github]
A couple of weeks ago I read this post about cross-validation done wrong. During cross-validation, we are typically trying to understand how well our model can generalize, and how well it can predict our outcome of interest on unseen samples. The author of the blog post makes some good points, especially about feature selection. It is indeed common malpractice to perform feature selection before we go into cross-validation, something that should however be done during cross-validation, so that the selected features are only derived from training data, and not from pooled training and validation data. However, the article doesn’t touch a problem that is a major issue in most clinical research, i.e. how to properly cross-validate when we have imbalanced data. As a matter of fact, in the context of many medical applications, we have datasets where we have two classes for the main outcome; normal samples and relevant samples. For example in a cancer detection application we might have a small percentages of patients with cancer (relevant samples) while the majority of samples might be healthy individuals. Outside of the medical space, this is true (even more) for the case for example of fraud detection, where the rate of relevant samples (i.e. frauds) to normal samples might be even in the order of 1 to 100 000. problem at hand
The main motivation behind the need to preprocess imbalanced data before we feed them into a classifier is that typically classifiers are more sensitive to detecting the majority class and less sensitive to the minority class. Thus, if we don't take care of the issue, the classification output will be biased, in many cases resulting in always predicting the majority class. Many methods have been proposed in the past few years to deal with imbalanced data. This is not really my area of research, however since I started working on preterm birth prediction, I had to deal with the problem more often. Preterm birth refers to pregnancies shorter than 37 weeks, and results in about 6-7% of all deliveries in most European countries, and 11% of all deliveries in the U.S., therefore the data are quite imbalanced.
I recently came across two papers [1, 2] predicting term and preterm deliveries using Electrohysterography (EHG) data. The authors used one single cross-sectional EHG recording (capturing the electrical activity of the uterus) and claimed near perfect accuracy in discriminating between the two classes (AUC value of 0.99 [2], compared to AUC = 0.52-0.60 without oversampling). This seemed to me like a clear case of overfitting and bad cross-validation, for a couple of reasons. First of all, let’s just look at the data: 
The density plots above show the feature's distribution for four features over the two classes, term and preterm (f = false, the delivery was not preterm, in light red, t = true, the delivery was preterm, in light blue). As we can see there is really not much discriminative power here between conditions. The extracted features are completely overlapping between the two classes and we might have a "garbage in, garbage out" issue, more than a "this is not enough data" issue.
Just thinking about the problem domain, should also raise some doubts, when we see results as high as auc = 0.99. The term/preterm distinction is almost arbitrary, set to 37 weeks of pregnancy. If you deliver at 36 weeks and 6 days, you are labeled preterm. On the other hand, if you deliver at 37 weeks and 1 day, you are labeled term. Obviously, there is no actual difference due to being term or preterm between two people that deliver that close, it's just a convention, and as such, prediction results will always be affected and most likely very inaccurate around the 37 weeks threshold. Since the dataset used is available for anyone to download and use from Physionet, in this post I will partially replicate the published results, and show how to properly cross-validate when oversampling data. Maybe some clarification on this issue will help in avoiding the same mistakes in the future.
The topic of EE estimation or physical activity assessment is gaining more and more interest lately, with the release of many activity trackers in the consumer market, some of them claiming higher accuracy due to a combination of accelerometer and physiological data (e.g. Bodymedia, Basis or the Apple watch). However, simply combining multiple signals, without personalization, provides suboptimal results, as I'll show in this post.
Let's take heart rate (HR) as an example. HR is the most commonly used physiological parameter to monitor physical activity and is getting used more and more with the introduction of many wrist-based HR monitors. HR can be key in providing accurate, personalized estimates at the individual level due to the strong relation between oxygen consumption, HR and EE within one individual. Here we can see how EE and HR evolve during different activities performed by one individual. The signals follow a similar trend. Pearson's correlation coefficient between HR and EE is 0.98, clearly, HR can be used as a predictor of EE. 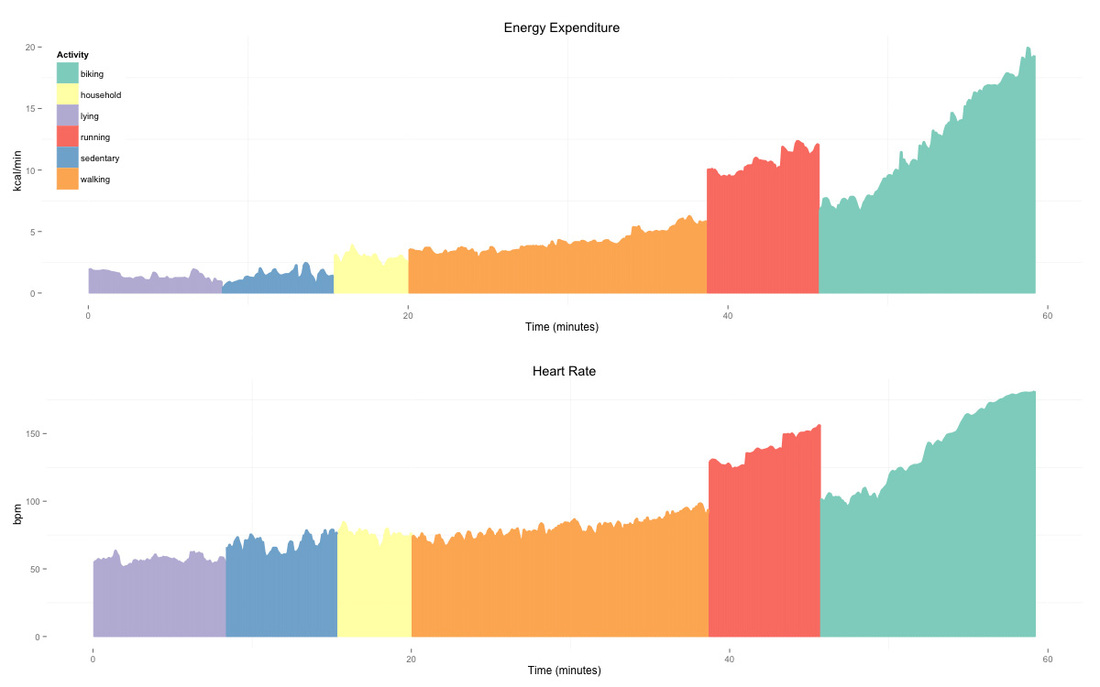
This post is about machine learning for energy expenditure (EE) estimation. More specifically, I'll show how to model the relation between accelerometer, physiological data and EE using Bayesian models and hierarchical regression.
During my PhD I've been working on developing EE models combining accelerometer and physiological data acquired using wearable sensors. I mainly focused on developing personalization techniques able to normalize physiological data across individuals, without the need for individual calibration.
Figure highlights:
However, this individual-specific relation does not hold across individuals, challenging standard population-based approaches for EE estimation. As a result, individual calibration and laboratory tests are needed to normalize HR. The rationale behind the need for normalization is that individuals with similar body size expend similar amounts of energy during a certain activity, however their HR differs depending on other factors, for example, fitness. Let's look at another example to clarify this point. Here we have walking, running and biking data from two participants, the similar body size (weight P1: 57 and P2: 52 kg, height P1: 166 and P2: 169 cm), results in similar levels of EE for the same activities, as shown in the two plots on the left side. However, the different fitness level (VO2max P1: 2100 ml/min and P2: 3130 ml/min) results in higher HR for the unfit participant, as shown in the two plot on the right end side. Thus, estimation models relying on HR to predict EE will result in underestimations and overestimations of EE. 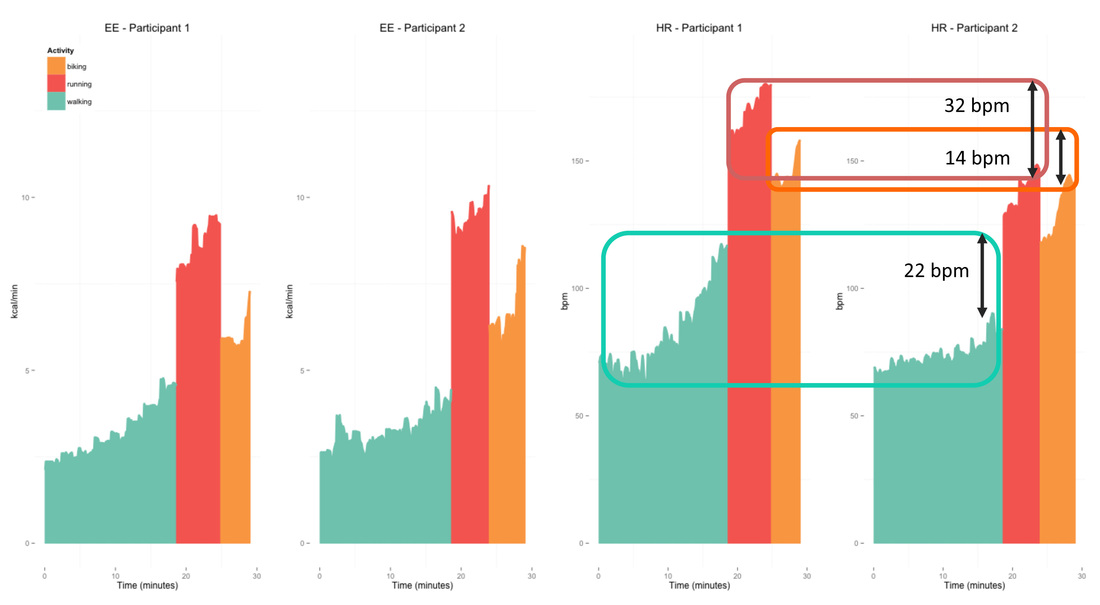
Figure highlights:
The main focus of my research was then to define methods and models able to take into account variability in physiological signals between individuals without the need for individual calibration. Let's take a step back, and start with the basics.
cardiovascular endurance and fitness
Moving on, let’s introduce the concept of cardiovascular endurance or cardiorespiratory fitness. Cardiorespiratory fitness (from now on just fitness) is defined as the ability of the circulatory and respiratory systems to supply oxygen during sustained physical activity. Fitness is not only an objective measure of habitual physical activity, but also a useful diagnostic and prognostic health indicator for patients in clinical settings, as well as healthy individuals [1]. Fitness is considered among the most important determinants of health and wellbeing.
In this post, my interest is purely related to performance in sports. So everything that follows should be considered in this context. |
Marco ALtiniFounder of HRV4Training, Advisor @Oura , Guest Lecturer @VUamsterdam , Editor @ieeepervasive. PhD Data Science, 2x MSc: Sport Science, Computer Science Engineering. Runner Archives
May 2023
|




 RSS Feed